Event submissions
Published

This submission belongs to the session S4. Meteorology of the event The 6th International Electronic Conference on Atmospheric Sciences
Published date
01 Nov, 2023
Academic Editor
'%3e%3cpath%20d='M12.6657%2010.9104C12.4185%2010.325%2012.0599%209.79327%2011.6097%209.34482C11.1609%208.89508%2010.6293%208.5365%2010.0442%208.28888C10.0389%208.28626%2010.0337%208.28495%2010.0285%208.28233C10.8446%207.69279%2011.3752%206.73249%2011.3752%205.64904C11.3752%203.8542%209.92103%202.39999%208.1262%202.39999C6.33136%202.39999%204.87715%203.8542%204.87715%205.64904C4.87715%206.73249%205.40774%207.69279%206.22393%208.28364C6.21869%208.28626%206.21345%208.28757%206.20821%208.29019C5.62129%208.5378%205.09463%208.89284%204.64265%209.34613C4.1929%209.79493%203.83432%2010.3266%203.58671%2010.9117C3.34345%2011.4845%203.21226%2012.0987%203.20023%2012.7209C3.19988%2012.7349%203.20233%2012.7488%203.20744%2012.7619C3.21255%2012.7749%203.22022%2012.7867%203.22998%2012.7968C3.23975%2012.8068%203.25142%2012.8147%203.26431%2012.8202C3.2772%2012.8256%203.29105%2012.8284%203.30504%2012.8284H4.09109C4.14874%2012.8284%204.19459%2012.7825%204.1959%2012.7262C4.2221%2011.7148%204.62823%2010.7676%205.34617%2010.0497C6.08899%209.30683%207.0755%208.89808%208.1262%208.89808C9.17689%208.89808%2010.1634%209.30683%2010.9062%2010.0497C11.6242%2010.7676%2012.0303%2011.7148%2012.0565%2012.7262C12.0578%2012.7838%2012.1037%2012.8284%2012.1613%2012.8284H12.9474C12.9613%2012.8284%2012.9752%2012.8256%2012.9881%2012.8202C13.001%2012.8147%2013.0126%2012.8068%2013.0224%2012.7968C13.0322%2012.7867%2013.0398%2012.7749%2013.0449%2012.7619C13.0501%2012.7488%2013.0525%2012.7349%2013.0522%2012.7209C13.0391%2012.0947%2012.9094%2011.4855%2012.6657%2010.9104ZM8.1262%207.9024C7.52486%207.9024%206.9589%207.6679%206.53312%207.24211C6.10733%206.81633%205.87283%206.25037%205.87283%205.64904C5.87283%205.0477%206.10733%204.48174%206.53312%204.05596C6.9589%203.63018%207.52486%203.39567%208.1262%203.39567C8.72753%203.39567%209.29349%203.63018%209.71927%204.05596C10.1451%204.48174%2010.3796%205.0477%2010.3796%205.64904C10.3796%206.25037%2010.1451%206.81633%209.71927%207.24211C9.29349%207.6679%208.72753%207.9024%208.1262%207.9024Z'%20fill='%235D1EE1'/%3e%3c/g%3e%3c/svg%3e) Anthony Lupo
Anthony LupoCitation
Saeed Rasekhi, Isidro A. Pérez, M. Ángeles García, Fatemeh Pazoki, Trend and cycle of fluctuations and statistical distribution of temperature of Berlin, Germany, in the period 1995-2012, in Proceedings of The 6th International Electronic Conference on Atmospheric Sciences, 15 October–30 October 2023, MDPI: Basel, Switzerland, doi: 10.3390/ecas2023-15704
Share
Email
Facebook
Twitter
LinkedIn
Trend and cycle of fluctuations and statistical distribution of temperature of Berlin, Germany, in the period 1995-2012

Saeed Rasekhi 1

Isidro A. Pérez 1

M. Ángeles García 1
'%3e%3cpath%20d='M12.6647%2010.9104C12.4176%2010.325%2012.0589%209.7933%2011.6088%209.34485C11.16%208.89511%2010.6283%208.53653%2010.0432%208.28891C10.038%208.28629%2010.0327%208.28498%2010.0275%208.28236C10.8437%207.69282%2011.3743%206.73252%2011.3743%205.64907C11.3743%203.85423%209.92005%202.40002%208.12522%202.40002C6.33038%202.40002%204.87618%203.85423%204.87618%205.64907C4.87618%206.73252%205.40677%207.69282%206.22296%208.28367C6.21772%208.28629%206.21248%208.2876%206.20724%208.29022C5.62031%208.53783%205.09365%208.89287%204.64167%209.34616C4.19192%209.79496%203.83334%2010.3266%203.58573%2010.9117C3.34247%2011.4846%203.21128%2012.0987%203.19925%2012.721C3.1989%2012.735%203.20135%2012.7489%203.20646%2012.7619C3.21157%2012.7749%203.21924%2012.7868%203.22901%2012.7968C3.23877%2012.8068%203.25045%2012.8148%203.26334%2012.8202C3.27623%2012.8256%203.29007%2012.8284%203.30406%2012.8284H4.09012C4.14776%2012.8284%204.19362%2012.7825%204.19493%2012.7262C4.22113%2011.7148%204.62726%2010.7676%205.34519%2010.0497C6.08802%209.30686%207.07452%208.89811%208.12522%208.89811C9.17592%208.89811%2010.1624%209.30686%2010.9052%2010.0497C11.6232%2010.7676%2012.0293%2011.7148%2012.0555%2012.7262C12.0568%2012.7839%2012.1027%2012.8284%2012.1603%2012.8284H12.9464C12.9604%2012.8284%2012.9742%2012.8256%2012.9871%2012.8202C13%2012.8148%2013.0117%2012.8068%2013.0214%2012.7968C13.0312%2012.7868%2013.0389%2012.7749%2013.044%2012.7619C13.0491%2012.7489%2013.0515%2012.735%2013.0512%2012.721C13.0381%2012.0947%2012.9084%2011.4856%2012.6647%2010.9104ZM8.12522%207.90243C7.52388%207.90243%206.95792%207.66793%206.53214%207.24215C6.10636%206.81636%205.87185%206.2504%205.87185%205.64907C5.87185%205.04773%206.10636%204.48177%206.53214%204.05599C6.95792%203.63021%207.52388%203.3957%208.12522%203.3957C8.72655%203.3957%209.29252%203.63021%209.7183%204.05599C10.1441%204.48177%2010.3786%205.04773%2010.3786%205.64907C10.3786%206.2504%2010.1441%206.81636%209.7183%207.24215C9.29252%207.66793%208.72655%207.90243%208.12522%207.90243Z'%20fill='%235D1EE1'/%3e%3c/g%3e%3c/svg%3e)
Fatemeh Pazoki 1
1. Universidad de Valladolid
Abstract
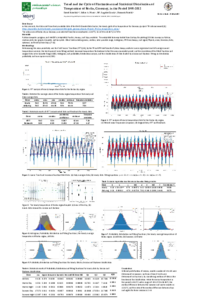
Temperature, as one of the most important factors in meteorological data analysis, is a variable parameter with severe changes in different periods. The trend of temperature changes over time is also of particular importance to investigating climate change. In this research, using the data from the TRY Project, which includes meteorological data with an accuracy of 1 km grid and a time accuracy of 1 hour, the temperature parameter of the city of Berlin is selected and the average temperature of the urban area of Berlin was calculated at different temporal scales. In addition to finding the linear regression trend of average annual temperature increase, Fourier transforms analysis and the least squared error fitting method was used to investigate harmonic temperature fluctuations to find the main sinusoidal period. Further, with the statistical analysis of data in daily averages and 1-hour intervals by considering medians of data as the benchmark for classification, months from April to October were determined as the hot months of the year, and hours from 9 to 19 were determined as daytime. Based on the mentioned classification, it was found that while the median difference between hot and cold months is 12.5 ˚C, the median difference between days and nights for the data related to the hot months and cold months is 5 ˚C and 2.1 ˚C, respectively. With this classification, the probability distribution of temperature was studied for each group, and the degree of similarity of this distribution with probability distribution functions such as normal, beta, gamma, and cosine were investigated. The separate analysis of the data categorized by this method had the highest degree of similarity with beta and normal functions.
Keywords
Temperature Trend
Harmonic Analysis
Statistics
Distribution Functions
Manuscript
sciforum-074734 done.pdf
Poster
Poster.pdf
Computational Fluid Dynamics models to estimate pedestrian exposure to traffic related air pollutants: A review
Can magmatic volcanoes produce black carbon aerosol at powerful explosive eruptions?