Event submissions
Published
This submission belongs to the session S4. Meteorology of the event The 7th International Electronic Conference on Atmospheric Sciences
Published date
30 May, 2025
Academic Editor
'%3e%3cpath%20d='M12.6657%2010.9104C12.4185%2010.325%2012.0599%209.79327%2011.6097%209.34482C11.1609%208.89508%2010.6293%208.5365%2010.0442%208.28888C10.0389%208.28626%2010.0337%208.28495%2010.0285%208.28233C10.8446%207.69279%2011.3752%206.73249%2011.3752%205.64904C11.3752%203.8542%209.92103%202.39999%208.1262%202.39999C6.33136%202.39999%204.87715%203.8542%204.87715%205.64904C4.87715%206.73249%205.40774%207.69279%206.22393%208.28364C6.21869%208.28626%206.21345%208.28757%206.20821%208.29019C5.62129%208.5378%205.09463%208.89284%204.64265%209.34613C4.1929%209.79493%203.83432%2010.3266%203.58671%2010.9117C3.34345%2011.4845%203.21226%2012.0987%203.20023%2012.7209C3.19988%2012.7349%203.20233%2012.7488%203.20744%2012.7619C3.21255%2012.7749%203.22022%2012.7867%203.22998%2012.7968C3.23975%2012.8068%203.25142%2012.8147%203.26431%2012.8202C3.2772%2012.8256%203.29105%2012.8284%203.30504%2012.8284H4.09109C4.14874%2012.8284%204.19459%2012.7825%204.1959%2012.7262C4.2221%2011.7148%204.62823%2010.7676%205.34617%2010.0497C6.08899%209.30683%207.0755%208.89808%208.1262%208.89808C9.17689%208.89808%2010.1634%209.30683%2010.9062%2010.0497C11.6242%2010.7676%2012.0303%2011.7148%2012.0565%2012.7262C12.0578%2012.7838%2012.1037%2012.8284%2012.1613%2012.8284H12.9474C12.9613%2012.8284%2012.9752%2012.8256%2012.9881%2012.8202C13.001%2012.8147%2013.0126%2012.8068%2013.0224%2012.7968C13.0322%2012.7867%2013.0398%2012.7749%2013.0449%2012.7619C13.0501%2012.7488%2013.0525%2012.7349%2013.0522%2012.7209C13.0391%2012.0947%2012.9094%2011.4855%2012.6657%2010.9104ZM8.1262%207.9024C7.52486%207.9024%206.9589%207.6679%206.53312%207.24211C6.10733%206.81633%205.87283%206.25037%205.87283%205.64904C5.87283%205.0477%206.10733%204.48174%206.53312%204.05596C6.9589%203.63018%207.52486%203.39567%208.1262%203.39567C8.72753%203.39567%209.29349%203.63018%209.71927%204.05596C10.1451%204.48174%2010.3796%205.0477%2010.3796%205.64904C10.3796%206.25037%2010.1451%206.81633%209.71927%207.24211C9.29349%207.6679%208.72753%207.9024%208.1262%207.9024Z'%20fill='%235D1EE1'/%3e%3c/g%3e%3c/svg%3e) Merhala Thurai
Merhala ThuraiCitation
Paulo Vítor de Albuquerque Mendes, Daniel Milano Costa de Lima, Fabricio Daniel dos Santos Silva, Helber Barros Gomes, Katyelle Ferreira da Silva Bezerra, Maria Cristina Lemos da Silva, Mario Henrique Guilherme dos Santos Varderlei, Matheus José Arruda Lyra, Mayara Christine Correia Lins, Millikan Lima de Oliveira, The Climatology and synoptic conditions of the driest and warmest months in Northeast Brazil, in Proceedings of The 7th International Electronic Conference on Atmospheric Sciences, 4 June–6 June 2025, MDPI: Basel, Switzerland
Share
Email
Facebook
Twitter
LinkedIn
The Climatology and synoptic conditions of the driest and warmest months in Northeast Brazil
'%3e%3cpath%20d='M12.6647%2010.9104C12.4176%2010.325%2012.0589%209.7933%2011.6088%209.34485C11.16%208.89511%2010.6283%208.53653%2010.0432%208.28891C10.038%208.28629%2010.0327%208.28498%2010.0275%208.28236C10.8437%207.69282%2011.3743%206.73252%2011.3743%205.64907C11.3743%203.85423%209.92005%202.40002%208.12522%202.40002C6.33038%202.40002%204.87618%203.85423%204.87618%205.64907C4.87618%206.73252%205.40677%207.69282%206.22296%208.28367C6.21772%208.28629%206.21248%208.2876%206.20724%208.29022C5.62031%208.53783%205.09365%208.89287%204.64167%209.34616C4.19192%209.79496%203.83334%2010.3266%203.58573%2010.9117C3.34247%2011.4846%203.21128%2012.0987%203.19925%2012.721C3.1989%2012.735%203.20135%2012.7489%203.20646%2012.7619C3.21157%2012.7749%203.21924%2012.7868%203.22901%2012.7968C3.23877%2012.8068%203.25045%2012.8148%203.26334%2012.8202C3.27623%2012.8256%203.29007%2012.8284%203.30406%2012.8284H4.09012C4.14776%2012.8284%204.19362%2012.7825%204.19493%2012.7262C4.22113%2011.7148%204.62726%2010.7676%205.34519%2010.0497C6.08802%209.30686%207.07452%208.89811%208.12522%208.89811C9.17592%208.89811%2010.1624%209.30686%2010.9052%2010.0497C11.6232%2010.7676%2012.0293%2011.7148%2012.0555%2012.7262C12.0568%2012.7839%2012.1027%2012.8284%2012.1603%2012.8284H12.9464C12.9604%2012.8284%2012.9742%2012.8256%2012.9871%2012.8202C13%2012.8148%2013.0117%2012.8068%2013.0214%2012.7968C13.0312%2012.7868%2013.0389%2012.7749%2013.044%2012.7619C13.0491%2012.7489%2013.0515%2012.735%2013.0512%2012.721C13.0381%2012.0947%2012.9084%2011.4856%2012.6647%2010.9104ZM8.12522%207.90243C7.52388%207.90243%206.95792%207.66793%206.53214%207.24215C6.10636%206.81636%205.87185%206.2504%205.87185%205.64907C5.87185%205.04773%206.10636%204.48177%206.53214%204.05599C6.95792%203.63021%207.52388%203.3957%208.12522%203.3957C8.72655%203.3957%209.29252%203.63021%209.7183%204.05599C10.1441%204.48177%2010.3786%205.04773%2010.3786%205.64907C10.3786%206.2504%2010.1441%206.81636%209.7183%207.24215C9.29252%207.66793%208.72655%207.90243%208.12522%207.90243Z'%20fill='%235D1EE1'/%3e%3c/g%3e%3c/svg%3e)
Paulo Vítor de Albuquerque Mendes 1
Daniel Milano Costa de Lima 1

Fabricio Daniel dos Santos Silva 1

Helber Barros Gomes 1
Katyelle Ferreira da Silva Bezerra 1
Maria Cristina Lemos da Silva 1
Mario Henrique Guilherme dos Santos Varderlei 1
Matheus José Arruda Lyra 1
Mayara Christine Correia Lins 1
Millikan Lima de Oliveira 1
1. Universidade Federal de Alagoas
Abstract
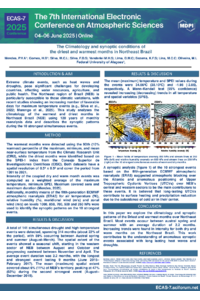
This study examines the climatology and synoptic patterns during the warmest and driest months in Northeast Brazil (NEB) using 120 years of monthly reanalysis data. The warmest months were detected based on the 90th (10% warmest) percentile of the maximum, minimum, and mean near-surface temperature from the Climate Research Unit (CRU), while the driest months were identified based on the SPEI-1 index from the Consejo Superior de Investigaciones Científicas (CISC). Both datasets have a spatial resolution of 0.5º x 0.5º and cover the period from 1901 to 2021. A total of 141 simultaneous drought and high-temperature events were detected, spanning 314 months (about 22% of the period), with 89% occurring between Austral spring and summer (August–March). The spatial extent of the events showed a seasonal shift, starting in the western sector of NEB between August and October and progressing eastward between November and April. The average event duration was 2.2 months, with the longest and strongest event lasting 9 months (June 2016–February 2017). The mean (maximum) spatial extent covered about 6% (11%) of NEB's territory, peaking at 47% (68%) during the second strongest event (August–December 2015). The mean (maximum) temperature and SPEI values during the events were 34.66ºC (38.10ºC) and -1.98 (-2.85), respectively. A Mann–Kendall test (95% confidence) revealed increasing (or decreasing) trends in all temperature and spatial variables (SPEI), suggesting an intensification of events over time. A synoptic analysis of the 10 strongest events based on the fifth-generation ECMWF atmospheric reanalysis (ERA5) suggested atmospheric blocking over the Atlântic and anomalous positioning of Upper Tropospheric Cyclonic Vortices (UTCVs) over NEB’s central and western sectors to be the main contributors to these events. It is believed that long-lasting UTCVs contribute to surface heating and precipitation reduction due to the subsidence of cold air in their center.
Keywords
drought
heat_waves
Poster
Poster_Mendes_PVA.pdf
Applying remote sensing techniques to investigate the trajectory of smoke plumes during biomass burning events
Pellet Production: Impact of Pollutants and Associated Health Risks