Event submissions
Published
This submission belongs to the session S5. Agricultural Water Management of the event The 3rd International Online Conference on Agriculture
Published date
20 Oct, 2025
Academic Editor
'%3e%3cpath%20d='M12.6657%2010.9104C12.4185%2010.325%2012.0599%209.79327%2011.6097%209.34482C11.1609%208.89508%2010.6293%208.5365%2010.0442%208.28888C10.0389%208.28626%2010.0337%208.28495%2010.0285%208.28233C10.8446%207.69279%2011.3752%206.73249%2011.3752%205.64904C11.3752%203.8542%209.92103%202.39999%208.1262%202.39999C6.33136%202.39999%204.87715%203.8542%204.87715%205.64904C4.87715%206.73249%205.40774%207.69279%206.22393%208.28364C6.21869%208.28626%206.21345%208.28757%206.20821%208.29019C5.62129%208.5378%205.09463%208.89284%204.64265%209.34613C4.1929%209.79493%203.83432%2010.3266%203.58671%2010.9117C3.34345%2011.4845%203.21226%2012.0987%203.20023%2012.7209C3.19988%2012.7349%203.20233%2012.7488%203.20744%2012.7619C3.21255%2012.7749%203.22022%2012.7867%203.22998%2012.7968C3.23975%2012.8068%203.25142%2012.8147%203.26431%2012.8202C3.2772%2012.8256%203.29105%2012.8284%203.30504%2012.8284H4.09109C4.14874%2012.8284%204.19459%2012.7825%204.1959%2012.7262C4.2221%2011.7148%204.62823%2010.7676%205.34617%2010.0497C6.08899%209.30683%207.0755%208.89808%208.1262%208.89808C9.17689%208.89808%2010.1634%209.30683%2010.9062%2010.0497C11.6242%2010.7676%2012.0303%2011.7148%2012.0565%2012.7262C12.0578%2012.7838%2012.1037%2012.8284%2012.1613%2012.8284H12.9474C12.9613%2012.8284%2012.9752%2012.8256%2012.9881%2012.8202C13.001%2012.8147%2013.0126%2012.8068%2013.0224%2012.7968C13.0322%2012.7867%2013.0398%2012.7749%2013.0449%2012.7619C13.0501%2012.7488%2013.0525%2012.7349%2013.0522%2012.7209C13.0391%2012.0947%2012.9094%2011.4855%2012.6657%2010.9104ZM8.1262%207.9024C7.52486%207.9024%206.9589%207.6679%206.53312%207.24211C6.10733%206.81633%205.87283%206.25037%205.87283%205.64904C5.87283%205.0477%206.10733%204.48174%206.53312%204.05596C6.9589%203.63018%207.52486%203.39567%208.1262%203.39567C8.72753%203.39567%209.29349%203.63018%209.71927%204.05596C10.1451%204.48174%2010.3796%205.0477%2010.3796%205.64904C10.3796%206.25037%2010.1451%206.81633%209.71927%207.24211C9.29349%207.6679%208.72753%207.9024%208.1262%207.9024Z'%20fill='%235D1EE1'/%3e%3c/g%3e%3c/svg%3e) Bin Gao
Bin GaoCitation
Suresh Mondal, Arun Prasad Kumar, Integrating Vegetation and Thermal Indices for Agricultural Drought Monitoring using Google Earth Engine: A Study from the Semi-Arid region of South India, in Proceedings of The 3rd International Online Conference on Agriculture, 22 October–24 October 2025, MDPI: Basel, Switzerland
Share
Email
Facebook
Twitter
LinkedIn
Integrating Vegetation and Thermal Indices for Agricultural Drought Monitoring using Google Earth Engine: A Study from the Semi-Arid region of South India
'%3e%3cpath%20d='M12.6647%2010.9104C12.4176%2010.325%2012.0589%209.7933%2011.6088%209.34485C11.16%208.89511%2010.6283%208.53653%2010.0432%208.28891C10.038%208.28629%2010.0327%208.28498%2010.0275%208.28236C10.8437%207.69282%2011.3743%206.73252%2011.3743%205.64907C11.3743%203.85423%209.92005%202.40002%208.12522%202.40002C6.33038%202.40002%204.87618%203.85423%204.87618%205.64907C4.87618%206.73252%205.40677%207.69282%206.22296%208.28367C6.21772%208.28629%206.21248%208.2876%206.20724%208.29022C5.62031%208.53783%205.09365%208.89287%204.64167%209.34616C4.19192%209.79496%203.83334%2010.3266%203.58573%2010.9117C3.34247%2011.4846%203.21128%2012.0987%203.19925%2012.721C3.1989%2012.735%203.20135%2012.7489%203.20646%2012.7619C3.21157%2012.7749%203.21924%2012.7868%203.22901%2012.7968C3.23877%2012.8068%203.25045%2012.8148%203.26334%2012.8202C3.27623%2012.8256%203.29007%2012.8284%203.30406%2012.8284H4.09012C4.14776%2012.8284%204.19362%2012.7825%204.19493%2012.7262C4.22113%2011.7148%204.62726%2010.7676%205.34519%2010.0497C6.08802%209.30686%207.07452%208.89811%208.12522%208.89811C9.17592%208.89811%2010.1624%209.30686%2010.9052%2010.0497C11.6232%2010.7676%2012.0293%2011.7148%2012.0555%2012.7262C12.0568%2012.7839%2012.1027%2012.8284%2012.1603%2012.8284H12.9464C12.9604%2012.8284%2012.9742%2012.8256%2012.9871%2012.8202C13%2012.8148%2013.0117%2012.8068%2013.0214%2012.7968C13.0312%2012.7868%2013.0389%2012.7749%2013.044%2012.7619C13.0491%2012.7489%2013.0515%2012.735%2013.0512%2012.721C13.0381%2012.0947%2012.9084%2011.4856%2012.6647%2010.9104ZM8.12522%207.90243C7.52388%207.90243%206.95792%207.66793%206.53214%207.24215C6.10636%206.81636%205.87185%206.2504%205.87185%205.64907C5.87185%205.04773%206.10636%204.48177%206.53214%204.05599C6.95792%203.63021%207.52388%203.3957%208.12522%203.3957C8.72655%203.3957%209.29252%203.63021%209.7183%204.05599C10.1441%204.48177%2010.3786%205.04773%2010.3786%205.64907C10.3786%206.2504%2010.1441%206.81636%209.7183%207.24215C9.29252%207.66793%208.72655%207.90243%208.12522%207.90243Z'%20fill='%235D1EE1'/%3e%3c/g%3e%3c/svg%3e)
Suresh Mondal 1

Arun Prasad Kumar 1
1. Department of Geography, School of Earth Sciences, Central University of Tamil Nadu, Thiruvarur, Tamil Nadu, 610005, India
Abstract
Timely assessing drought conditions is the key to managing the risks posed by water scarcity to agriculture, the environment, and socio-economic stability. In this context, agricultural drought monitoring is vital in semi-arid regions like Tamil Nadu, India. This study aims to evaluate and compare the performance of two remote sensing-based drought indicators —the Temperature Vegetation Dryness Index (TVDI) and the Crop Water Stress Index (CWSI) over Tamil Nadu, India—during the Rabi season. Both indices were generated through Google Earth Engine (GEE) using the MODIS-based Normalized Difference Vegetation Index (NDVI), Land Surface Temperature (LST), and evapotranspiration (ET) data at a monthly scale. A pixel-wise relationship between the NDVI and LST was used to derive the TVDI, while the CWSI was calculated using the energy balance approach. The monthly spatial and temporal dynamics of the TVDI and CWSI were analyzed across the Rabi season. The results revealed a strong positive correlation between the TVDI and CWSI, indicating consistent detection of drought stress across the region. To assess the accuracy of the indices, the Standardized Precipitation Index (SPI) was used, which shows statistically significant correlations for both indices, with the CWSI demonstrating slightly stronger agreement. Furthermore, drought severity was categorized into four levels: mild, moderate, severe, and extreme. All districts within the study area were categorized based on drought severity levels, with several key districts consistently identified as drought-prone. Overall, the results suggest that both indices are suitable for representing drought patterns; their combined application enhances the robustness of drought monitoring with minor differences in sensitivity and spatial expression. This study demonstrates the potential of integrating thermal and vegetation-based remote sensing indices for improved agricultural drought assessment in semi-arid regions like Tamil Nadu.
Keywords
Keywords: Agricultural drought
remote sensing
TVDI
CWSI
SPI
GEE
Tamil Nadu
Poster
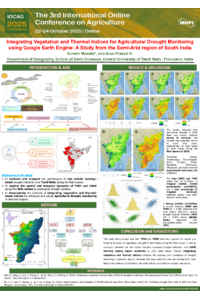
MDPI_Agricultural_Conference_Poster_2025.pdf
Hydro-Justice in Farming: Smart Solutions to Prevent Water Waste and Territorial Disputes
YIELD AND GRAIN QUALITY OF HYBRID AND INBRED LOWLAND RICE (Oryza sativa L.) AS INFLUENCED BY COMBINED APPLICATION OF INORGANIC AND ORGANIC FERTILIZERS SUPPLEMENTED WITH CARABAO MANURE TEA