Event submissions
Published
This submission belongs to the session S7. Agricultural Soil of the event The 3rd International Online Conference on Agriculture
Published date
20 Oct, 2025
Academic Editor
'%3e%3cpath%20d='M12.6657%2010.9104C12.4185%2010.325%2012.0599%209.79327%2011.6097%209.34482C11.1609%208.89508%2010.6293%208.5365%2010.0442%208.28888C10.0389%208.28626%2010.0337%208.28495%2010.0285%208.28233C10.8446%207.69279%2011.3752%206.73249%2011.3752%205.64904C11.3752%203.8542%209.92103%202.39999%208.1262%202.39999C6.33136%202.39999%204.87715%203.8542%204.87715%205.64904C4.87715%206.73249%205.40774%207.69279%206.22393%208.28364C6.21869%208.28626%206.21345%208.28757%206.20821%208.29019C5.62129%208.5378%205.09463%208.89284%204.64265%209.34613C4.1929%209.79493%203.83432%2010.3266%203.58671%2010.9117C3.34345%2011.4845%203.21226%2012.0987%203.20023%2012.7209C3.19988%2012.7349%203.20233%2012.7488%203.20744%2012.7619C3.21255%2012.7749%203.22022%2012.7867%203.22998%2012.7968C3.23975%2012.8068%203.25142%2012.8147%203.26431%2012.8202C3.2772%2012.8256%203.29105%2012.8284%203.30504%2012.8284H4.09109C4.14874%2012.8284%204.19459%2012.7825%204.1959%2012.7262C4.2221%2011.7148%204.62823%2010.7676%205.34617%2010.0497C6.08899%209.30683%207.0755%208.89808%208.1262%208.89808C9.17689%208.89808%2010.1634%209.30683%2010.9062%2010.0497C11.6242%2010.7676%2012.0303%2011.7148%2012.0565%2012.7262C12.0578%2012.7838%2012.1037%2012.8284%2012.1613%2012.8284H12.9474C12.9613%2012.8284%2012.9752%2012.8256%2012.9881%2012.8202C13.001%2012.8147%2013.0126%2012.8068%2013.0224%2012.7968C13.0322%2012.7867%2013.0398%2012.7749%2013.0449%2012.7619C13.0501%2012.7488%2013.0525%2012.7349%2013.0522%2012.7209C13.0391%2012.0947%2012.9094%2011.4855%2012.6657%2010.9104ZM8.1262%207.9024C7.52486%207.9024%206.9589%207.6679%206.53312%207.24211C6.10733%206.81633%205.87283%206.25037%205.87283%205.64904C5.87283%205.0477%206.10733%204.48174%206.53312%204.05596C6.9589%203.63018%207.52486%203.39567%208.1262%203.39567C8.72753%203.39567%209.29349%203.63018%209.71927%204.05596C10.1451%204.48174%2010.3796%205.0477%2010.3796%205.64904C10.3796%206.25037%2010.1451%206.81633%209.71927%207.24211C9.29349%207.6679%208.72753%207.9024%208.1262%207.9024Z'%20fill='%235D1EE1'/%3e%3c/g%3e%3c/svg%3e) MARGA ROS
MARGA ROSCitation
Saffi Ur Rehman, Zahid Maqbool, Muhammad Adnan Shahid, Mapping soil salinity by integrating field EC measurements and Landsat-derived spectral Indices by cloud-based geospatial analysis, in Proceedings of The 3rd International Online Conference on Agriculture, 22 October–24 October 2025, MDPI: Basel, Switzerland
Share
Email
Facebook
Twitter
LinkedIn
Mapping soil salinity by integrating field EC measurements and Landsat-derived spectral Indices by cloud-based geospatial analysis

Saffi Ur Rehman 1
'%3e%3cpath%20d='M12.6647%2010.9104C12.4176%2010.325%2012.0589%209.7933%2011.6088%209.34485C11.16%208.89511%2010.6283%208.53653%2010.0432%208.28891C10.038%208.28629%2010.0327%208.28498%2010.0275%208.28236C10.8437%207.69282%2011.3743%206.73252%2011.3743%205.64907C11.3743%203.85423%209.92005%202.40002%208.12522%202.40002C6.33038%202.40002%204.87618%203.85423%204.87618%205.64907C4.87618%206.73252%205.40677%207.69282%206.22296%208.28367C6.21772%208.28629%206.21248%208.2876%206.20724%208.29022C5.62031%208.53783%205.09365%208.89287%204.64167%209.34616C4.19192%209.79496%203.83334%2010.3266%203.58573%2010.9117C3.34247%2011.4846%203.21128%2012.0987%203.19925%2012.721C3.1989%2012.735%203.20135%2012.7489%203.20646%2012.7619C3.21157%2012.7749%203.21924%2012.7868%203.22901%2012.7968C3.23877%2012.8068%203.25045%2012.8148%203.26334%2012.8202C3.27623%2012.8256%203.29007%2012.8284%203.30406%2012.8284H4.09012C4.14776%2012.8284%204.19362%2012.7825%204.19493%2012.7262C4.22113%2011.7148%204.62726%2010.7676%205.34519%2010.0497C6.08802%209.30686%207.07452%208.89811%208.12522%208.89811C9.17592%208.89811%2010.1624%209.30686%2010.9052%2010.0497C11.6232%2010.7676%2012.0293%2011.7148%2012.0555%2012.7262C12.0568%2012.7839%2012.1027%2012.8284%2012.1603%2012.8284H12.9464C12.9604%2012.8284%2012.9742%2012.8256%2012.9871%2012.8202C13%2012.8148%2013.0117%2012.8068%2013.0214%2012.7968C13.0312%2012.7868%2013.0389%2012.7749%2013.044%2012.7619C13.0491%2012.7489%2013.0515%2012.735%2013.0512%2012.721C13.0381%2012.0947%2012.9084%2011.4856%2012.6647%2010.9104ZM8.12522%207.90243C7.52388%207.90243%206.95792%207.66793%206.53214%207.24215C6.10636%206.81636%205.87185%206.2504%205.87185%205.64907C5.87185%205.04773%206.10636%204.48177%206.53214%204.05599C6.95792%203.63021%207.52388%203.3957%208.12522%203.3957C8.72655%203.3957%209.29252%203.63021%209.7183%204.05599C10.1441%204.48177%2010.3786%205.04773%2010.3786%205.64907C10.3786%206.2504%2010.1441%206.81636%209.7183%207.24215C9.29252%207.66793%208.72655%207.90243%208.12522%207.90243Z'%20fill='%235D1EE1'/%3e%3c/g%3e%3c/svg%3e)
Zahid Maqbool 2
Muhammad Adnan Shahid 2,3
1. College of Agricultural Science and Engineering, Hohai University, Nanjing 210098, China.
2. Agricultural Remote Sensing Lab, National Centre for GIS and Space Applications (NCGSA), University of Agriculture, Faisalabad 38000, Pakistan.
3. Department of Irrigation and Drainage, University of Agriculture, Faisalabad 38000, Pakistan.
Abstract
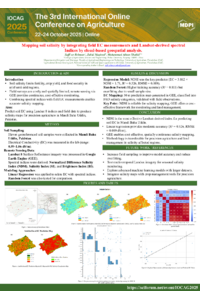
Soil salinity is an essential constraint to sustainable crop production related to soil fertility, especially in arid and semi-arid regions. This study presents a data-driven approach for mapping soil salinity by integrating field-based electrical conductivity (EC) measurements with remote sensing and geospatial analysis in the district of Mandi Baha Uddin, Pakistan. Eleven georeferenced soil samples were collected and analyzed for EC (range: 0.59–1.06 dS/m), serving as training data for model calibration. Using Landsat 8 Surface Reflectance imagery within Google Earth Engine, spectral indices Normalized Difference Salinity Index (NDSI), Salinity Index (SI), and Brightness Index (BI) were extracted. Among various modeling approaches, a linear regression model was applied to these indices, revealing NDSI as the most significant predictor (coefficient = 3.862), while SI and BI showed negligible contribution. The model achieved moderate accuracy (R² = 0.526, RMSE = 0.089 dS/m). A Random Forest approach yielded higher training accuracy (R² = 0.811) but suffered from overfitting during cross-validation, indicating limited sample size constraints. The regression equation (EC = 3.862 × NDSI + 1.71) was applied in GEE to generate the EC prediction map. The resulting 30-meter resolution EC map was classified into FAO salinity categories and validated through independent field observations. This framework highlights the effectiveness of using freely available satellite data and cloud-based platforms like GEE for cost-effective soil salinity monitoring. This study provides a transferable methodology for precision agriculture, enabling informed land management and crop planning in salinity-affected regions.
Keywords
soil salinity
Landsat 8
electrical conductivity
regression model
Google Earth Engine
spectral indices
smart farming
remote sensing
precision agriculture
Poster
Poster.pdf
Effects of Sawdust-fortified Topsoil on the Spouting rate, Growth and Development of Mini-stem Propagated Plantain Suckers.
Characterization of Selected Problem Soils in Capiz, Philippines: Basis for the Development of an Intervention Program