Event submissions
Published
This submission belongs to the session S4. Urban Mobility and Transportation of the event The 1st International Online Conference on Urban Sciences
Published date
15 May, 2026
Academic Editor
'%3e%3cpath%20d='M12.6657%2010.9104C12.4185%2010.325%2012.0599%209.79327%2011.6097%209.34482C11.1609%208.89508%2010.6293%208.5365%2010.0442%208.28888C10.0389%208.28626%2010.0337%208.28495%2010.0285%208.28233C10.8446%207.69279%2011.3752%206.73249%2011.3752%205.64904C11.3752%203.8542%209.92103%202.39999%208.1262%202.39999C6.33136%202.39999%204.87715%203.8542%204.87715%205.64904C4.87715%206.73249%205.40774%207.69279%206.22393%208.28364C6.21869%208.28626%206.21345%208.28757%206.20821%208.29019C5.62129%208.5378%205.09463%208.89284%204.64265%209.34613C4.1929%209.79493%203.83432%2010.3266%203.58671%2010.9117C3.34345%2011.4845%203.21226%2012.0987%203.20023%2012.7209C3.19988%2012.7349%203.20233%2012.7488%203.20744%2012.7619C3.21255%2012.7749%203.22022%2012.7867%203.22998%2012.7968C3.23975%2012.8068%203.25142%2012.8147%203.26431%2012.8202C3.2772%2012.8256%203.29105%2012.8284%203.30504%2012.8284H4.09109C4.14874%2012.8284%204.19459%2012.7825%204.1959%2012.7262C4.2221%2011.7148%204.62823%2010.7676%205.34617%2010.0497C6.08899%209.30683%207.0755%208.89808%208.1262%208.89808C9.17689%208.89808%2010.1634%209.30683%2010.9062%2010.0497C11.6242%2010.7676%2012.0303%2011.7148%2012.0565%2012.7262C12.0578%2012.7838%2012.1037%2012.8284%2012.1613%2012.8284H12.9474C12.9613%2012.8284%2012.9752%2012.8256%2012.9881%2012.8202C13.001%2012.8147%2013.0126%2012.8068%2013.0224%2012.7968C13.0322%2012.7867%2013.0398%2012.7749%2013.0449%2012.7619C13.0501%2012.7488%2013.0525%2012.7349%2013.0522%2012.7209C13.0391%2012.0947%2012.9094%2011.4855%2012.6657%2010.9104ZM8.1262%207.9024C7.52486%207.9024%206.9589%207.6679%206.53312%207.24211C6.10733%206.81633%205.87283%206.25037%205.87283%205.64904C5.87283%205.0477%206.10733%204.48174%206.53312%204.05596C6.9589%203.63018%207.52486%203.39567%208.1262%203.39567C8.72753%203.39567%209.29349%203.63018%209.71927%204.05596C10.1451%204.48174%2010.3796%205.0477%2010.3796%205.64904C10.3796%206.25037%2010.1451%206.81633%209.71927%207.24211C9.29349%207.6679%208.72753%207.9024%208.1262%207.9024Z'%20fill='%235D1EE1'/%3e%3c/g%3e%3c/svg%3e) Sergio Nesmachnow
Sergio NesmachnowCitation
Leila Maceo Golzari-Hunt, Elsa Anderson, Portrait of the Ambulatory Disabled in Philadelphia, in Proceedings of The 1st International Online Conference on Urban Sciences, 20 May–22 May 2026, MDPI: Basel, Switzerland
Share
Email
Facebook
Twitter
LinkedIn
Portrait of the Ambulatory Disabled in Philadelphia
'%3e%3cpath%20d='M12.6647%2010.9104C12.4176%2010.325%2012.0589%209.7933%2011.6088%209.34485C11.16%208.89511%2010.6283%208.53653%2010.0432%208.28891C10.038%208.28629%2010.0327%208.28498%2010.0275%208.28236C10.8437%207.69282%2011.3743%206.73252%2011.3743%205.64907C11.3743%203.85423%209.92005%202.40002%208.12522%202.40002C6.33038%202.40002%204.87618%203.85423%204.87618%205.64907C4.87618%206.73252%205.40677%207.69282%206.22296%208.28367C6.21772%208.28629%206.21248%208.2876%206.20724%208.29022C5.62031%208.53783%205.09365%208.89287%204.64167%209.34616C4.19192%209.79496%203.83334%2010.3266%203.58573%2010.9117C3.34247%2011.4846%203.21128%2012.0987%203.19925%2012.721C3.1989%2012.735%203.20135%2012.7489%203.20646%2012.7619C3.21157%2012.7749%203.21924%2012.7868%203.22901%2012.7968C3.23877%2012.8068%203.25045%2012.8148%203.26334%2012.8202C3.27623%2012.8256%203.29007%2012.8284%203.30406%2012.8284H4.09012C4.14776%2012.8284%204.19362%2012.7825%204.19493%2012.7262C4.22113%2011.7148%204.62726%2010.7676%205.34519%2010.0497C6.08802%209.30686%207.07452%208.89811%208.12522%208.89811C9.17592%208.89811%2010.1624%209.30686%2010.9052%2010.0497C11.6232%2010.7676%2012.0293%2011.7148%2012.0555%2012.7262C12.0568%2012.7839%2012.1027%2012.8284%2012.1603%2012.8284H12.9464C12.9604%2012.8284%2012.9742%2012.8256%2012.9871%2012.8202C13%2012.8148%2013.0117%2012.8068%2013.0214%2012.7968C13.0312%2012.7868%2013.0389%2012.7749%2013.044%2012.7619C13.0491%2012.7489%2013.0515%2012.735%2013.0512%2012.721C13.0381%2012.0947%2012.9084%2011.4856%2012.6647%2010.9104ZM8.12522%207.90243C7.52388%207.90243%206.95792%207.66793%206.53214%207.24215C6.10636%206.81636%205.87185%206.2504%205.87185%205.64907C5.87185%205.04773%206.10636%204.48177%206.53214%204.05599C6.95792%203.63021%207.52388%203.3957%208.12522%203.3957C8.72655%203.3957%209.29252%203.63021%209.7183%204.05599C10.1441%204.48177%2010.3786%205.04773%2010.3786%205.64907C10.3786%206.2504%2010.1441%206.81636%209.7183%207.24215C9.29252%207.66793%208.72655%207.90243%208.12522%207.90243Z'%20fill='%235D1EE1'/%3e%3c/g%3e%3c/svg%3e)
Leila Maceo Golzari-Hunt 1
Elsa Anderson 2
1. Julia R. Masterman School, Philadelphia, Pennsylvania, 19104, USA
2. Northwestern University, Evanston, Illinois 60208, USA
Abstract
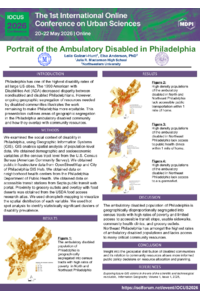
Introduction: Philadelphia has one of the highest disability rates of all large US cities. The 1990 American with Disabilities Act decreased disparity between nondisabled and disabled Philadelphians. However, ongoing geographic segregation of resources needed by disabled communities illustrates the work remaining to make Philadelphia more equitable. This presentation outlines areas of geographic segregation in the Philadelphia ambulatory disabled community and how they overlap with community resources.
Methods: To examine the social context of disability in Philadelphia, we employed Geographic Information Systems (GIS). GIS enables spatial analysis of population-level data. Data sources included the U.S. Census Bureau (American Community Survey 5-Year Estimates) for demographic and socioeconomic variables at the census tract level. OpenStreetMap and City of Philadelphia GIS Hub provided spatial layers for public infrastructure. Philadelphia Department of Public Health provided data on neighborhood health centers. The Septa public transit web portal provided data on accessible transit stations. Proximity to grocery outlets and overlay with food deserts was obtained from the USDA food access research atlas. Chloropleth mapping was used to visualize the spatial distribution of each variable. Hot spot analysis was used to identify statistically significant clusters of disability prevalence. Spatial autocorrelation was used to assess the degree of clustering.
Results: The ambulatory disabled population of Philadelphia is geographically disproportionally segregated into census tracts with high rates of poverty and limited access to accessible transit stops, usable sidewalks, community health clinics, and grocery outlets. Northeast Philadelphia has amongst the highest rates of ambulatory disabled populations and lacks access to many critical community resources.
Conclusion: The ambulatory disabled population of Philadelphia is geographically segregated into census tracts with limited access to necessary community resources. Insight into the geospatial distribution of disabled communities and its relation to community resources will allow more informed public policy decisions on resource allocation and planning.
Keywords
geospatial information systems
GIS
accessibility
disabled populations
urban planning
american with disabilities act
ADA
Poster
Conference_Poster.pdf
A Stage-Gate Decision Architecture for Freight–Passenger Integration in Urban Public Transport Systems
Spatial disconnectivity: Singapore's perspective on cycling