Event submissions
Published
This submission belongs to the session S3. Laboratory medicine of the event The 1st International Online Conference on Diagnostics
Published date
18 Sep, 2026
Academic Editor
'%3e%3cpath%20d='M12.6657%2010.9104C12.4185%2010.325%2012.0599%209.79327%2011.6097%209.34482C11.1609%208.89508%2010.6293%208.5365%2010.0442%208.28888C10.0389%208.28626%2010.0337%208.28495%2010.0285%208.28233C10.8446%207.69279%2011.3752%206.73249%2011.3752%205.64904C11.3752%203.8542%209.92103%202.39999%208.1262%202.39999C6.33136%202.39999%204.87715%203.8542%204.87715%205.64904C4.87715%206.73249%205.40774%207.69279%206.22393%208.28364C6.21869%208.28626%206.21345%208.28757%206.20821%208.29019C5.62129%208.5378%205.09463%208.89284%204.64265%209.34613C4.1929%209.79493%203.83432%2010.3266%203.58671%2010.9117C3.34345%2011.4845%203.21226%2012.0987%203.20023%2012.7209C3.19988%2012.7349%203.20233%2012.7488%203.20744%2012.7619C3.21255%2012.7749%203.22022%2012.7867%203.22998%2012.7968C3.23975%2012.8068%203.25142%2012.8147%203.26431%2012.8202C3.2772%2012.8256%203.29105%2012.8284%203.30504%2012.8284H4.09109C4.14874%2012.8284%204.19459%2012.7825%204.1959%2012.7262C4.2221%2011.7148%204.62823%2010.7676%205.34617%2010.0497C6.08899%209.30683%207.0755%208.89808%208.1262%208.89808C9.17689%208.89808%2010.1634%209.30683%2010.9062%2010.0497C11.6242%2010.7676%2012.0303%2011.7148%2012.0565%2012.7262C12.0578%2012.7838%2012.1037%2012.8284%2012.1613%2012.8284H12.9474C12.9613%2012.8284%2012.9752%2012.8256%2012.9881%2012.8202C13.001%2012.8147%2013.0126%2012.8068%2013.0224%2012.7968C13.0322%2012.7867%2013.0398%2012.7749%2013.0449%2012.7619C13.0501%2012.7488%2013.0525%2012.7349%2013.0522%2012.7209C13.0391%2012.0947%2012.9094%2011.4855%2012.6657%2010.9104ZM8.1262%207.9024C7.52486%207.9024%206.9589%207.6679%206.53312%207.24211C6.10733%206.81633%205.87283%206.25037%205.87283%205.64904C5.87283%205.0477%206.10733%204.48174%206.53312%204.05596C6.9589%203.63018%207.52486%203.39567%208.1262%203.39567C8.72753%203.39567%209.29349%203.63018%209.71927%204.05596C10.1451%204.48174%2010.3796%205.0477%2010.3796%205.64904C10.3796%206.25037%2010.1451%206.81633%209.71927%207.24211C9.29349%207.6679%208.72753%207.9024%208.1262%207.9024Z'%20fill='%235D1EE1'/%3e%3c/g%3e%3c/svg%3e) Marijn M. Speeckaert
Marijn M. SpeeckaertCitation
Noor A Mohamed, Ibrahim A. Hashim, Assessment of Albuminuria in a Bloody Urine, in Proceedings of The 1st International Online Conference on Diagnostics, 23 September–24 September 2026, MDPI: Basel, Switzerland
Share
Email
Facebook
Twitter
LinkedIn
Assessment of Albuminuria in a Bloody Urine
'%3e%3cpath%20d='M12.6647%2010.9104C12.4176%2010.325%2012.0589%209.7933%2011.6088%209.34485C11.16%208.89511%2010.6283%208.53653%2010.0432%208.28891C10.038%208.28629%2010.0327%208.28498%2010.0275%208.28236C10.8437%207.69282%2011.3743%206.73252%2011.3743%205.64907C11.3743%203.85423%209.92005%202.40002%208.12522%202.40002C6.33038%202.40002%204.87618%203.85423%204.87618%205.64907C4.87618%206.73252%205.40677%207.69282%206.22296%208.28367C6.21772%208.28629%206.21248%208.2876%206.20724%208.29022C5.62031%208.53783%205.09365%208.89287%204.64167%209.34616C4.19192%209.79496%203.83334%2010.3266%203.58573%2010.9117C3.34247%2011.4846%203.21128%2012.0987%203.19925%2012.721C3.1989%2012.735%203.20135%2012.7489%203.20646%2012.7619C3.21157%2012.7749%203.21924%2012.7868%203.22901%2012.7968C3.23877%2012.8068%203.25045%2012.8148%203.26334%2012.8202C3.27623%2012.8256%203.29007%2012.8284%203.30406%2012.8284H4.09012C4.14776%2012.8284%204.19362%2012.7825%204.19493%2012.7262C4.22113%2011.7148%204.62726%2010.7676%205.34519%2010.0497C6.08802%209.30686%207.07452%208.89811%208.12522%208.89811C9.17592%208.89811%2010.1624%209.30686%2010.9052%2010.0497C11.6232%2010.7676%2012.0293%2011.7148%2012.0555%2012.7262C12.0568%2012.7839%2012.1027%2012.8284%2012.1603%2012.8284H12.9464C12.9604%2012.8284%2012.9742%2012.8256%2012.9871%2012.8202C13%2012.8148%2013.0117%2012.8068%2013.0214%2012.7968C13.0312%2012.7868%2013.0389%2012.7749%2013.044%2012.7619C13.0491%2012.7489%2013.0515%2012.735%2013.0512%2012.721C13.0381%2012.0947%2012.9084%2011.4856%2012.6647%2010.9104ZM8.12522%207.90243C7.52388%207.90243%206.95792%207.66793%206.53214%207.24215C6.10636%206.81636%205.87185%206.2504%205.87185%205.64907C5.87185%205.04773%206.10636%204.48177%206.53214%204.05599C6.95792%203.63021%207.52388%203.3957%208.12522%203.3957C8.72655%203.3957%209.29252%203.63021%209.7183%204.05599C10.1441%204.48177%2010.3786%205.04773%2010.3786%205.64907C10.3786%206.2504%2010.1441%206.81636%209.7183%207.24215C9.29252%207.66793%208.72655%207.90243%208.12522%207.90243Z'%20fill='%235D1EE1'/%3e%3c/g%3e%3c/svg%3e)
Noor A Mohamed 1
Ibrahim A. Hashim 2
1. College of Science, George Mason University, Fairfax, Virginia, USA
2. Department of Pathology, UT Southwestern Medical Center, Dallas, Texas, USA
Abstract
Introduction: Measurement of proteinuria is central to the assessment of renal function where both the amount and nature of protein in urines are indicative of the aetiology of kidney dysfunction. Interference in the assessment of albuminuria include the presence of blood, casts, infection, drug metabolites among others. This study assessed the frequency of blood in urine samples, the amount, as well as possible impact on albuminuria estimation.
Methods: Retrospective analysis of results for albumin creatinine ratio, haematuria and blood in urine samples analysed over 22 months were performed. Statistical analysis was performed using Microsoft ExcelÒ .
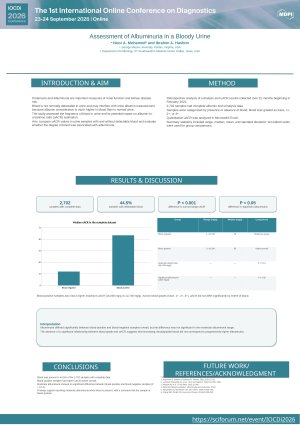
Results: A total of 2,702 samples with complete set of albumin and urinalysis data were obtained. Among samples negative for blood, albumin to creatinine ratio ranged from 1 to 12,748 (median 18 mg/g) compared with 2 to 16,038 (65 mg/g) in samples positive for the presence of blood. There was significant difference in albumin creatinine ratio in normal samples (albumin creatinine <30 mg/g) (P<0.001) and in patients with significant albuminuria (³ 300 mg/g) (P<0.05). However, among samples with moderate albuminuria (30 – 299 mg/g) there was no significant difference in albumin creatinine levels between blood negative and positive samples (P=0.14). When comparing the degree of blood presence, graded as trace, 1+, 2+, and 3+, the corresponding albumin creatinine levels ranged from 2 to 7223 (median 723), from 2 to 7874 (77), from 4 to 6816 (62), and from 6 to 6135 (76) respectively. There was no significant difference in albumin creatinine levels and the extent of blood presence.
Discussion: Although there was significant difference in albuminuria between samples with and without blood presence, the difference was not significant in samples with moderate albuminuria. Furthermore, there was no significant relationship between albuminuria and extent of blood present. This finding supports reporting resulst for moderate albuminuria.
Keywords
Albuminuria
blood
urine
hematuria
Poster
IOCDi2026_Albuminuria_Bloody_Urine_Poster.pdf
Proactive Depression Screening via Human-Integrated AI: Synergizing Multimodal Smartphone Biomarkers and Game As Reality for the Global South
Comparative Effects of Risperidone, Olanzapine and Aripiprazole on Serum Prolactin Levels in Patients with Psychiatric Disorders