Event submissions
Published
This submission belongs to the session S4. Process Control, Monitoring and Machine Learning of the event The 5th International Electronic Conference on Processes
Published date
15 Oct, 2026
Academic Editor
'%3e%3cpath%20d='M12.6657%2010.9104C12.4185%2010.325%2012.0599%209.79327%2011.6097%209.34482C11.1609%208.89508%2010.6293%208.5365%2010.0442%208.28888C10.0389%208.28626%2010.0337%208.28495%2010.0285%208.28233C10.8446%207.69279%2011.3752%206.73249%2011.3752%205.64904C11.3752%203.8542%209.92103%202.39999%208.1262%202.39999C6.33136%202.39999%204.87715%203.8542%204.87715%205.64904C4.87715%206.73249%205.40774%207.69279%206.22393%208.28364C6.21869%208.28626%206.21345%208.28757%206.20821%208.29019C5.62129%208.5378%205.09463%208.89284%204.64265%209.34613C4.1929%209.79493%203.83432%2010.3266%203.58671%2010.9117C3.34345%2011.4845%203.21226%2012.0987%203.20023%2012.7209C3.19988%2012.7349%203.20233%2012.7488%203.20744%2012.7619C3.21255%2012.7749%203.22022%2012.7867%203.22998%2012.7968C3.23975%2012.8068%203.25142%2012.8147%203.26431%2012.8202C3.2772%2012.8256%203.29105%2012.8284%203.30504%2012.8284H4.09109C4.14874%2012.8284%204.19459%2012.7825%204.1959%2012.7262C4.2221%2011.7148%204.62823%2010.7676%205.34617%2010.0497C6.08899%209.30683%207.0755%208.89808%208.1262%208.89808C9.17689%208.89808%2010.1634%209.30683%2010.9062%2010.0497C11.6242%2010.7676%2012.0303%2011.7148%2012.0565%2012.7262C12.0578%2012.7838%2012.1037%2012.8284%2012.1613%2012.8284H12.9474C12.9613%2012.8284%2012.9752%2012.8256%2012.9881%2012.8202C13.001%2012.8147%2013.0126%2012.8068%2013.0224%2012.7968C13.0322%2012.7867%2013.0398%2012.7749%2013.0449%2012.7619C13.0501%2012.7488%2013.0525%2012.7349%2013.0522%2012.7209C13.0391%2012.0947%2012.9094%2011.4855%2012.6657%2010.9104ZM8.1262%207.9024C7.52486%207.9024%206.9589%207.6679%206.53312%207.24211C6.10733%206.81633%205.87283%206.25037%205.87283%205.64904C5.87283%205.0477%206.10733%204.48174%206.53312%204.05596C6.9589%203.63018%207.52486%203.39567%208.1262%203.39567C8.72753%203.39567%209.29349%203.63018%209.71927%204.05596C10.1451%204.48174%2010.3796%205.0477%2010.3796%205.64904C10.3796%206.25037%2010.1451%206.81633%209.71927%207.24211C9.29349%207.6679%208.72753%207.9024%208.1262%207.9024Z'%20fill='%235D1EE1'/%3e%3c/g%3e%3c/svg%3e) Ravendra Singh
Ravendra SinghCitation
Altynay Almuhambetova, Elmira Almukhambetova, Digital Interpretation of Water Acidity (pH) for Environmental Process Monitoring, in Proceedings of The 5th International Electronic Conference on Processes, 20 October–22 October 2026, MDPI: Basel, Switzerland
Share
Email
Facebook
Twitter
LinkedIn
Digital Interpretation of Water Acidity (pH) for Environmental Process Monitoring
'%3e%3cpath%20d='M12.6647%2010.9104C12.4176%2010.325%2012.0589%209.7933%2011.6088%209.34485C11.16%208.89511%2010.6283%208.53653%2010.0432%208.28891C10.038%208.28629%2010.0327%208.28498%2010.0275%208.28236C10.8437%207.69282%2011.3743%206.73252%2011.3743%205.64907C11.3743%203.85423%209.92005%202.40002%208.12522%202.40002C6.33038%202.40002%204.87618%203.85423%204.87618%205.64907C4.87618%206.73252%205.40677%207.69282%206.22296%208.28367C6.21772%208.28629%206.21248%208.2876%206.20724%208.29022C5.62031%208.53783%205.09365%208.89287%204.64167%209.34616C4.19192%209.79496%203.83334%2010.3266%203.58573%2010.9117C3.34247%2011.4846%203.21128%2012.0987%203.19925%2012.721C3.1989%2012.735%203.20135%2012.7489%203.20646%2012.7619C3.21157%2012.7749%203.21924%2012.7868%203.22901%2012.7968C3.23877%2012.8068%203.25045%2012.8148%203.26334%2012.8202C3.27623%2012.8256%203.29007%2012.8284%203.30406%2012.8284H4.09012C4.14776%2012.8284%204.19362%2012.7825%204.19493%2012.7262C4.22113%2011.7148%204.62726%2010.7676%205.34519%2010.0497C6.08802%209.30686%207.07452%208.89811%208.12522%208.89811C9.17592%208.89811%2010.1624%209.30686%2010.9052%2010.0497C11.6232%2010.7676%2012.0293%2011.7148%2012.0555%2012.7262C12.0568%2012.7839%2012.1027%2012.8284%2012.1603%2012.8284H12.9464C12.9604%2012.8284%2012.9742%2012.8256%2012.9871%2012.8202C13%2012.8148%2013.0117%2012.8068%2013.0214%2012.7968C13.0312%2012.7868%2013.0389%2012.7749%2013.044%2012.7619C13.0491%2012.7489%2013.0515%2012.735%2013.0512%2012.721C13.0381%2012.0947%2012.9084%2011.4856%2012.6647%2010.9104ZM8.12522%207.90243C7.52388%207.90243%206.95792%207.66793%206.53214%207.24215C6.10636%206.81636%205.87185%206.2504%205.87185%205.64907C5.87185%205.04773%206.10636%204.48177%206.53214%204.05599C6.95792%203.63021%207.52388%203.3957%208.12522%203.3957C8.72655%203.3957%209.29252%203.63021%209.7183%204.05599C10.1441%204.48177%2010.3786%205.04773%2010.3786%205.64907C10.3786%206.2504%2010.1441%206.81636%209.7183%207.24215C9.29252%207.66793%208.72655%207.90243%208.12522%207.90243Z'%20fill='%235D1EE1'/%3e%3c/g%3e%3c/svg%3e)
Altynay Almuhambetova 1
Elmira Almukhambetova 2
1. Lyceum (Chemical-Biological Track), Secondary School No. 95, Almaty 050000, Kazakhstan
2. Department of Emergency Medicine, Asfendiyarov Kazakh National Medical University, Almaty 050000, Kazakhstan
Abstract
Introduction
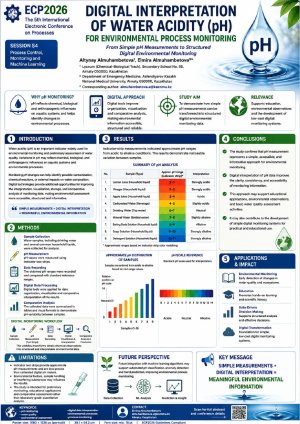
Water acidity (pH) is an important indicator widely used for environmental monitoring and preliminary assessment of water quality. Variations in pH may reflect chemical, biological, and anthropogenic influences on aquatic systems and environmental processes. Monitoring pH changes can help identify possible contamination, chemical reactions, or external impacts on water composition. Digital technologies provide additional opportunities for improving the interpretation, visualization, storage, and comparative analysis of monitoring data, making environmental assessment more accessible, structured, and informative.
Methods
Water samples, including drinking water and several common household liquids, were analyzed using pH indicator test strips. The obtained pH values were recorded and compared with standard reference ranges. Digital tools were applied for data organization, visualization, and comparative interpretation of the results in order to identify differences between the studied samples. The collected data were summarized in tables and visual formats to simplify interpretation and demonstrate pH variability between samples.
Results
The analyzed samples demonstrated noticeable variation in pH values. Several samples showed deviations from neutral pH, reflecting differences in their chemical characteristics and possible external influences. Digital interpretation tools simplified data comparison and visualization, allowing clearer identification of pH variations as indicators of environmental and chemical processes. The graphical presentation of the obtained data improved the clarity of monitoring results and facilitated comparative analysis between different water samples.
Conclusions
The study confirms that pH measurement represents a simple, accessible, and informative approach for preliminary environmental monitoring. Digital interpretation of pH data improves the clarity, consistency, and accessibility of monitoring results and may support educational applications, environmental observations, and basic water quality assessment activities. This approach may also contribute to the development of simple digital environmental monitoring systems for practical and educational use.
Keywords
pH monitoring
water quality
environmental assessment
digital data interpretation
environmental processes
Poster
Постер Алтынай 2026.pdf
Machine Learning-Based Anomaly Detection and Analysis in Control Systems
AI-based smart inspection of date fruit to support postharvest artificial ripening decisions