Event submissions
Events1st International Online Conference on Agriculture - Advances in Agricultural Science and Technology
Published

This submission belongs to the session 5. Agricultural Soils of the event 1st International Online Conference on Agriculture - Advances in Agricultural Science and Technology
Published date
18 Feb, 2022
Academic Editor
'%3e%3cpath%20d='M12.6657%2010.9104C12.4185%2010.325%2012.0599%209.79327%2011.6097%209.34482C11.1609%208.89508%2010.6293%208.5365%2010.0442%208.28888C10.0389%208.28626%2010.0337%208.28495%2010.0285%208.28233C10.8446%207.69279%2011.3752%206.73249%2011.3752%205.64904C11.3752%203.8542%209.92103%202.39999%208.1262%202.39999C6.33136%202.39999%204.87715%203.8542%204.87715%205.64904C4.87715%206.73249%205.40774%207.69279%206.22393%208.28364C6.21869%208.28626%206.21345%208.28757%206.20821%208.29019C5.62129%208.5378%205.09463%208.89284%204.64265%209.34613C4.1929%209.79493%203.83432%2010.3266%203.58671%2010.9117C3.34345%2011.4845%203.21226%2012.0987%203.20023%2012.7209C3.19988%2012.7349%203.20233%2012.7488%203.20744%2012.7619C3.21255%2012.7749%203.22022%2012.7867%203.22998%2012.7968C3.23975%2012.8068%203.25142%2012.8147%203.26431%2012.8202C3.2772%2012.8256%203.29105%2012.8284%203.30504%2012.8284H4.09109C4.14874%2012.8284%204.19459%2012.7825%204.1959%2012.7262C4.2221%2011.7148%204.62823%2010.7676%205.34617%2010.0497C6.08899%209.30683%207.0755%208.89808%208.1262%208.89808C9.17689%208.89808%2010.1634%209.30683%2010.9062%2010.0497C11.6242%2010.7676%2012.0303%2011.7148%2012.0565%2012.7262C12.0578%2012.7838%2012.1037%2012.8284%2012.1613%2012.8284H12.9474C12.9613%2012.8284%2012.9752%2012.8256%2012.9881%2012.8202C13.001%2012.8147%2013.0126%2012.8068%2013.0224%2012.7968C13.0322%2012.7867%2013.0398%2012.7749%2013.0449%2012.7619C13.0501%2012.7488%2013.0525%2012.7349%2013.0522%2012.7209C13.0391%2012.0947%2012.9094%2011.4855%2012.6657%2010.9104ZM8.1262%207.9024C7.52486%207.9024%206.9589%207.6679%206.53312%207.24211C6.10733%206.81633%205.87283%206.25037%205.87283%205.64904C5.87283%205.0477%206.10733%204.48174%206.53312%204.05596C6.9589%203.63018%207.52486%203.39567%208.1262%203.39567C8.72753%203.39567%209.29349%203.63018%209.71927%204.05596C10.1451%204.48174%2010.3796%205.0477%2010.3796%205.64904C10.3796%206.25037%2010.1451%206.81633%209.71927%207.24211C9.29349%207.6679%208.72753%207.9024%208.1262%207.9024Z'%20fill='%235D1EE1'/%3e%3c/g%3e%3c/svg%3e) Raimundo Jimenez-Ballesta
Raimundo Jimenez-BallestaCitation
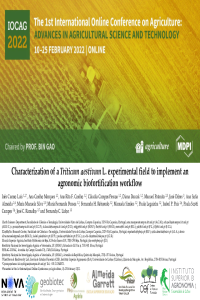
Inês Carmo Luís, Ana Coelho Marques, Ana Rita F. Coelho, Cláudia Campos Pessoa, Diana Daccak, Manuel Patanita, José Dôres, Ana Sofia Almeida, Maria Manuela Silva, Maria Fernanda Pessoa, Fernando H. Reboredo, Manuela Simões, Paulo Legoinha, Isabel P. Pais, Paula Scotti Campos, José C. Ramalho, Fernando C. Lidon, Characterization of a Triticum aestivum L. experimental field to implement an agronomic biofortification workflow, in Proceedings of 1st International Online Conference on Agriculture - Advances in Agricultural Science and Technology, 10 February–25 February 2022, MDPI: Basel, Switzerland, doi: 10.3390/IOCAG2022-12304
Share
Email
Facebook
Twitter
LinkedIn
Characterization of a Triticum aestivum L. experimental field to implement an agronomic biofortification workflow
'%3e%3cpath%20d='M12.6647%2010.9104C12.4176%2010.325%2012.0589%209.7933%2011.6088%209.34485C11.16%208.89511%2010.6283%208.53653%2010.0432%208.28891C10.038%208.28629%2010.0327%208.28498%2010.0275%208.28236C10.8437%207.69282%2011.3743%206.73252%2011.3743%205.64907C11.3743%203.85423%209.92005%202.40002%208.12522%202.40002C6.33038%202.40002%204.87618%203.85423%204.87618%205.64907C4.87618%206.73252%205.40677%207.69282%206.22296%208.28367C6.21772%208.28629%206.21248%208.2876%206.20724%208.29022C5.62031%208.53783%205.09365%208.89287%204.64167%209.34616C4.19192%209.79496%203.83334%2010.3266%203.58573%2010.9117C3.34247%2011.4846%203.21128%2012.0987%203.19925%2012.721C3.1989%2012.735%203.20135%2012.7489%203.20646%2012.7619C3.21157%2012.7749%203.21924%2012.7868%203.22901%2012.7968C3.23877%2012.8068%203.25045%2012.8148%203.26334%2012.8202C3.27623%2012.8256%203.29007%2012.8284%203.30406%2012.8284H4.09012C4.14776%2012.8284%204.19362%2012.7825%204.19493%2012.7262C4.22113%2011.7148%204.62726%2010.7676%205.34519%2010.0497C6.08802%209.30686%207.07452%208.89811%208.12522%208.89811C9.17592%208.89811%2010.1624%209.30686%2010.9052%2010.0497C11.6232%2010.7676%2012.0293%2011.7148%2012.0555%2012.7262C12.0568%2012.7839%2012.1027%2012.8284%2012.1603%2012.8284H12.9464C12.9604%2012.8284%2012.9742%2012.8256%2012.9871%2012.8202C13%2012.8148%2013.0117%2012.8068%2013.0214%2012.7968C13.0312%2012.7868%2013.0389%2012.7749%2013.044%2012.7619C13.0491%2012.7489%2013.0515%2012.735%2013.0512%2012.721C13.0381%2012.0947%2012.9084%2011.4856%2012.6647%2010.9104ZM8.12522%207.90243C7.52388%207.90243%206.95792%207.66793%206.53214%207.24215C6.10636%206.81636%205.87185%206.2504%205.87185%205.64907C5.87185%205.04773%206.10636%204.48177%206.53214%204.05599C6.95792%203.63021%207.52388%203.3957%208.12522%203.3957C8.72655%203.3957%209.29252%203.63021%209.7183%204.05599C10.1441%204.48177%2010.3786%205.04773%2010.3786%205.64907C10.3786%206.2504%2010.1441%206.81636%209.7183%207.24215C9.29252%207.66793%208.72655%207.90243%208.12522%207.90243Z'%20fill='%235D1EE1'/%3e%3c/g%3e%3c/svg%3e)
Inês Carmo Luís 1,2

Ana Coelho Marques 1,2

Ana Rita F. Coelho 1,2
Cláudia Campos Pessoa 1,2

Diana Daccak 1,2
Manuel Patanita 2,3
José Dôres 3
Ana Sofia Almeida 2,4

Maria Manuela Silva 2,5

Maria Fernanda Pessoa 1,2

Fernando H. Reboredo 1,2
Manuela Simões 1,2

Paulo Legoinha 1,2

Isabel P. Pais 2,6
Paula Scotti Campos 2,6

José C. Ramalho 2,7

Fernando C. Lidon 1,2
1. Earth Sciences Department, Faculdade de Ciências e Tecnologia, Universidade Nova de Lisboa, Campus Caparica, 2829-516 Caparica, Portugal
2. GeoBioTec Research Center, Faculdade de Ciências e Tecnologia, Universidade Nova de Lisboa, Campus Caparica, 2829-516 Caparica, Portugal
3. Escola Superior Agrária, Instituto Politécnico de Beja, R. Pedro Soares S/N, 7800-295 Beja, Portugal
4. INIAV, Instituto Nacional de Investigação Agrária e Veterinária, I.P. (INIAV), Estrada de Gil Vaz 6, 7351-901 Elvas, Portugal
5. ESEAG-COFAC, Avenida do Campo Grande 376, 1749-024 Lisboa, Portugal
6. INIAV, Instituto Nacional de Investigação Agrária e Veterinária, I.P. (INIAV), Avenida da República, Quinta do Marquês, 2780-157 Oeiras, Portugal
7. PlantStress & Biodiversity Lab, Centro de Estudos Florestais (CEF), Instituto Superior Agronomia (ISA), Universidade de Lisboa (ULisboa), Quinta do Marquês, Av. República, 2784-505 Oeiras, Portugal
Abstract
Soils provide plants both with a physical home and all the essential nutrients and support they crave to thrive. Such a circumstance paves the way to a close analysis of the level of viability of different types of soils. Hence the need to assess the suitability of the experimental field in which to implement an agronomic biofortification itinerary. Thus, soil samples were collected from different sites of the wheat field. A rectangular grid was applied. Afterwards, pH and electrical conductivity were determined with a potentiometer; the mineral quantification was measured using an XRF analyzer and color analyzes were performed with Minolta CR 400 colorimeter. Moisture and organic matter contents were also carried out. No significant differences were found when considering the moisture content, pH, electrical conductivity, and the mineral values of Fe and Mn. As opposed to this, slight differences were observed in organic matter content, color parameters and in Ca, K, S, Cu, and Zn. Concerning the macroelements, the most prevalent mineral was Ca, followed by K and S. As for the microelements, Zn was the least dominant mineral, as opposed to Cu, Mn and Fe. Data showed that this experimental field has proven to be eligible to implement an agronomic biofortification workflow due to the slightly acid pH and the lower amount of organic matter content.
Keywords
color analyzes
mineral quantification
organic matter
soil analyzes.
Manuscript
sciforum-054477-done.pdf
Oral Presentation
Apresentation2_Agriculture_Luís et al_2022.pptx
Poster
Apresentation2_Agriculture_Luís et al_2022.pdf
Yield and quality of winter wheat (Triticum aestivum L.) depending on multi-component foliar fertilization
Evaluation of biobased solutions for mycotoxin mitigation on stored maize