Event submissions
Published

This submission belongs to the session S4. Computational Chemistry of the event The 29th International Electronic Conference on Synthetic Organic Chemistry
Published date
12 Nov, 2025
Academic Editor
'%3e%3cpath%20d='M12.6657%2010.9104C12.4185%2010.325%2012.0599%209.79327%2011.6097%209.34482C11.1609%208.89508%2010.6293%208.5365%2010.0442%208.28888C10.0389%208.28626%2010.0337%208.28495%2010.0285%208.28233C10.8446%207.69279%2011.3752%206.73249%2011.3752%205.64904C11.3752%203.8542%209.92103%202.39999%208.1262%202.39999C6.33136%202.39999%204.87715%203.8542%204.87715%205.64904C4.87715%206.73249%205.40774%207.69279%206.22393%208.28364C6.21869%208.28626%206.21345%208.28757%206.20821%208.29019C5.62129%208.5378%205.09463%208.89284%204.64265%209.34613C4.1929%209.79493%203.83432%2010.3266%203.58671%2010.9117C3.34345%2011.4845%203.21226%2012.0987%203.20023%2012.7209C3.19988%2012.7349%203.20233%2012.7488%203.20744%2012.7619C3.21255%2012.7749%203.22022%2012.7867%203.22998%2012.7968C3.23975%2012.8068%203.25142%2012.8147%203.26431%2012.8202C3.2772%2012.8256%203.29105%2012.8284%203.30504%2012.8284H4.09109C4.14874%2012.8284%204.19459%2012.7825%204.1959%2012.7262C4.2221%2011.7148%204.62823%2010.7676%205.34617%2010.0497C6.08899%209.30683%207.0755%208.89808%208.1262%208.89808C9.17689%208.89808%2010.1634%209.30683%2010.9062%2010.0497C11.6242%2010.7676%2012.0303%2011.7148%2012.0565%2012.7262C12.0578%2012.7838%2012.1037%2012.8284%2012.1613%2012.8284H12.9474C12.9613%2012.8284%2012.9752%2012.8256%2012.9881%2012.8202C13.001%2012.8147%2013.0126%2012.8068%2013.0224%2012.7968C13.0322%2012.7867%2013.0398%2012.7749%2013.0449%2012.7619C13.0501%2012.7488%2013.0525%2012.7349%2013.0522%2012.7209C13.0391%2012.0947%2012.9094%2011.4855%2012.6657%2010.9104ZM8.1262%207.9024C7.52486%207.9024%206.9589%207.6679%206.53312%207.24211C6.10733%206.81633%205.87283%206.25037%205.87283%205.64904C5.87283%205.0477%206.10733%204.48174%206.53312%204.05596C6.9589%203.63018%207.52486%203.39567%208.1262%203.39567C8.72753%203.39567%209.29349%203.63018%209.71927%204.05596C10.1451%204.48174%2010.3796%205.0477%2010.3796%205.64904C10.3796%206.25037%2010.1451%206.81633%209.71927%207.24211C9.29349%207.6679%208.72753%207.9024%208.1262%207.9024Z'%20fill='%235D1EE1'/%3e%3c/g%3e%3c/svg%3e) Julio A. Seijas
Julio A. SeijasCitation
Van Hong Nguyen, Tuong Lam Vo Pham, My Phuong Nguyen Thi, Huy Phu Chu, Thuy Duong Nguyen Thi, Nhu Y Duong Thi, Quoc Dat Ho, The Sers Analysis of the Interaction Between AG8 Cluster and Adenine for Optical Sensor Applications Using DFT Calculations, in Proceedings of The 29th International Electronic Conference on Synthetic Organic Chemistry, 14 November–28 November 2025, MDPI: Basel, Switzerland, doi: 10.3390/ecsoc-29-26853
Share
Email
Facebook
Twitter
LinkedIn
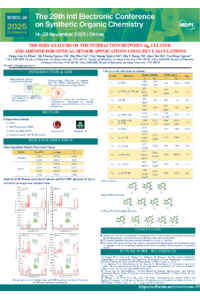
The Sers Analysis of the Interaction Between AG8 Cluster and Adenine for Optical Sensor Applications Using DFT Calculations
'%3e%3cpath%20d='M12.6647%2010.9104C12.4176%2010.325%2012.0589%209.7933%2011.6088%209.34485C11.16%208.89511%2010.6283%208.53653%2010.0432%208.28891C10.038%208.28629%2010.0327%208.28498%2010.0275%208.28236C10.8437%207.69282%2011.3743%206.73252%2011.3743%205.64907C11.3743%203.85423%209.92005%202.40002%208.12522%202.40002C6.33038%202.40002%204.87618%203.85423%204.87618%205.64907C4.87618%206.73252%205.40677%207.69282%206.22296%208.28367C6.21772%208.28629%206.21248%208.2876%206.20724%208.29022C5.62031%208.53783%205.09365%208.89287%204.64167%209.34616C4.19192%209.79496%203.83334%2010.3266%203.58573%2010.9117C3.34247%2011.4846%203.21128%2012.0987%203.19925%2012.721C3.1989%2012.735%203.20135%2012.7489%203.20646%2012.7619C3.21157%2012.7749%203.21924%2012.7868%203.22901%2012.7968C3.23877%2012.8068%203.25045%2012.8148%203.26334%2012.8202C3.27623%2012.8256%203.29007%2012.8284%203.30406%2012.8284H4.09012C4.14776%2012.8284%204.19362%2012.7825%204.19493%2012.7262C4.22113%2011.7148%204.62726%2010.7676%205.34519%2010.0497C6.08802%209.30686%207.07452%208.89811%208.12522%208.89811C9.17592%208.89811%2010.1624%209.30686%2010.9052%2010.0497C11.6232%2010.7676%2012.0293%2011.7148%2012.0555%2012.7262C12.0568%2012.7839%2012.1027%2012.8284%2012.1603%2012.8284H12.9464C12.9604%2012.8284%2012.9742%2012.8256%2012.9871%2012.8202C13%2012.8148%2013.0117%2012.8068%2013.0214%2012.7968C13.0312%2012.7868%2013.0389%2012.7749%2013.044%2012.7619C13.0491%2012.7489%2013.0515%2012.735%2013.0512%2012.721C13.0381%2012.0947%2012.9084%2011.4856%2012.6647%2010.9104ZM8.12522%207.90243C7.52388%207.90243%206.95792%207.66793%206.53214%207.24215C6.10636%206.81636%205.87185%206.2504%205.87185%205.64907C5.87185%205.04773%206.10636%204.48177%206.53214%204.05599C6.95792%203.63021%207.52388%203.3957%208.12522%203.3957C8.72655%203.3957%209.29252%203.63021%209.7183%204.05599C10.1441%204.48177%2010.3786%205.04773%2010.3786%205.64907C10.3786%206.2504%2010.1441%206.81636%209.7183%207.24215C9.29252%207.66793%208.72655%207.90243%208.12522%207.90243Z'%20fill='%235D1EE1'/%3e%3c/g%3e%3c/svg%3e)
Tuong Lam Vo Pham 1
My Phuong Nguyen Thi 1
Huy Phu Chu 1
Thuy Duong Nguyen Thi 1
Nhu Y Duong Thi 1
Quoc Dat Ho 1
Van Hong Nguyen 1
1. Department of Chemistry, Faculty of Education, An Giang University, Vietnam National University Ho Chi Minh City, Vietnam, Vietnam
Abstract
The Raman spectrum of adenine and the surface‐enhanced Raman spectrum (SERS) upon adsorption of adenine on an Ag₈ cluster in aqueous solution were calculated using the density functional theory method with the PBE0 hybrid functional and the Def2‐TZVP basis set, together with the integral equation formalism polarizable continuum model for the solvent (IEF‐PCM). TD‐DFT calculations were performed to determine the excitation wavelengths of adenine and the Ag8•A complex, thereby selecting excitation wavelengths compatible with available experimental Raman spectroscopy instruments. In addition, excitation wavelengths with the maximum oscillator strength were chosen to propose characteristic spectra for experimental studies. The calculated Raman activities were converted into Raman scattering intensities, and the enhancement factor was determined. The results show that an excitation wavelength of 325 nm gives the strongest and most distinct SERS signal, 532 nm provides stable signals suitable for commercial instruments, while 442 nm significantly reduces several characteristic vibrational bands. The study also constructed Raman and SERS spectra corresponding to the excitation wavelength with the maximum oscillator strength. The findings indicate that the Ag8 cluster greatly enhances the Raman signal of adenine. This study provides a basis for selecting excitation wavelengths and characteristic vibrational modes to identify adenine, supporting the development of label‐free biosensors based on silver clusters.
Keywords
DFT
cluster
SERS
characteristic vibrational
enhancement factor
Manuscript
chemproc-sciforum_143757_S4_original_Manuscript_SERS_Ag8_Adenine-done.pdf
Poster
POSTER (SERS Ag8-Adenine).pdf
Triterpenoid bis-amide analogs via Ugi reaction
One-pot synthesis of 3-tetrazolylmethyl-4H-chromen-4-ones via Ugi-azide reaction