Event submissions
EventsMOL2NET'18, Conference on Molecular, Biomed., Comput. & Network Science and Engineering, 4th ed.
Published

This submission belongs to the session 02. USEDAT-04: USA-Europe Data Analysis Training Program Workshop, Cambridge, UK-Bilbao, Spain-Miami, USA, 2018 of the event MOL2NET'18, Conference on Molecular, Biomed., Comput. & Network Science and Engineering, 4th ed.
Published date
14 Dec, 2018
Citation
Bernabe Ortega-Tenezaca, Viviana F. Quevedo-Tumailli, Víctor Cerda Mejía, Octavio Edelberto Guijarro Rubí, Estela Guardado Yordi, Amaury Pérez Martínez, Web Application for Real Time Data Visualization of Heat Sensor, in Proceedings of MOL2NET'18, Conference on Molecular, Biomed., Comput. & Network Science and Engineering, 4th ed., 15 January 2018–20 January 2019, MDPI: Basel, Switzerland, doi: 10.3390/mol2net-04-05909
Share
Email
Facebook
Twitter
LinkedIn
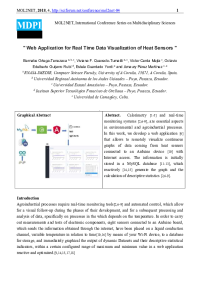
Web Application for Real Time Data Visualization of Heat Sensor

Bernabe Ortega-Tenezaca 1,2
'%3e%3cpath%20d='M12.6647%2010.9104C12.4176%2010.325%2012.0589%209.7933%2011.6088%209.34485C11.16%208.89511%2010.6283%208.53653%2010.0432%208.28891C10.038%208.28629%2010.0327%208.28498%2010.0275%208.28236C10.8437%207.69282%2011.3743%206.73252%2011.3743%205.64907C11.3743%203.85423%209.92005%202.40002%208.12522%202.40002C6.33038%202.40002%204.87618%203.85423%204.87618%205.64907C4.87618%206.73252%205.40677%207.69282%206.22296%208.28367C6.21772%208.28629%206.21248%208.2876%206.20724%208.29022C5.62031%208.53783%205.09365%208.89287%204.64167%209.34616C4.19192%209.79496%203.83334%2010.3266%203.58573%2010.9117C3.34247%2011.4846%203.21128%2012.0987%203.19925%2012.721C3.1989%2012.735%203.20135%2012.7489%203.20646%2012.7619C3.21157%2012.7749%203.21924%2012.7868%203.22901%2012.7968C3.23877%2012.8068%203.25045%2012.8148%203.26334%2012.8202C3.27623%2012.8256%203.29007%2012.8284%203.30406%2012.8284H4.09012C4.14776%2012.8284%204.19362%2012.7825%204.19493%2012.7262C4.22113%2011.7148%204.62726%2010.7676%205.34519%2010.0497C6.08802%209.30686%207.07452%208.89811%208.12522%208.89811C9.17592%208.89811%2010.1624%209.30686%2010.9052%2010.0497C11.6232%2010.7676%2012.0293%2011.7148%2012.0555%2012.7262C12.0568%2012.7839%2012.1027%2012.8284%2012.1603%2012.8284H12.9464C12.9604%2012.8284%2012.9742%2012.8256%2012.9871%2012.8202C13%2012.8148%2013.0117%2012.8068%2013.0214%2012.7968C13.0312%2012.7868%2013.0389%2012.7749%2013.044%2012.7619C13.0491%2012.7489%2013.0515%2012.735%2013.0512%2012.721C13.0381%2012.0947%2012.9084%2011.4856%2012.6647%2010.9104ZM8.12522%207.90243C7.52388%207.90243%206.95792%207.66793%206.53214%207.24215C6.10636%206.81636%205.87185%206.2504%205.87185%205.64907C5.87185%205.04773%206.10636%204.48177%206.53214%204.05599C6.95792%203.63021%207.52388%203.3957%208.12522%203.3957C8.72655%203.3957%209.29252%203.63021%209.7183%204.05599C10.1441%204.48177%2010.3786%205.04773%2010.3786%205.64907C10.3786%206.2504%2010.1441%206.81636%209.7183%207.24215C9.29252%207.66793%208.72655%207.90243%208.12522%207.90243Z'%20fill='%235D1EE1'/%3e%3c/g%3e%3c/svg%3e)
Viviana F. Quevedo-Tumailli 2,3

Víctor Cerda Mejía 4
Octavio Edelberto Guijarro Rubí 5
Estela Guardado Yordi 6
Amaury Pérez Martínez 4,6
1. RNASA-IMEDIR, Computer Science Faculty, University of A Coruña, 15071, A Coruña, Spain., Ecuador
2. Universidad Estatal Amazónica – Puyo, Pastaza, Ecuador.
3. RNASA-IMEDIR, Computer Science Faculty, University of A Coruña, 15071, A Coruña, Spain.
4. Universidad Estatal Amazónica
5. Instituto Superior Tecnológico Francisco de Orellana – Puyo, Pastaza, Ecuador.
6. Universidad de Camagüey, Cuba
Abstract
Calorimetry [1-5] and real-time monitoring systems [2,6-9], are essential aspects in environmental and agroindustrial processes. In this work, we develop a web application [6] that allows to remotely visualize continuous graphs of data coming from heat sensors connected to an Arduino device [10] with Internet access. The information is initially stored in a MySQL database [11-13], which reactively [14,15] generate the graph and the calculation of descriptive statistics [2,6-9].
Keywords
Real-time monitoring systems
Heat Sensor
Calorimetry
Agroindustrial Process
Poster
mol2net-04_MOL2NET-2018-template-BO.pdf
Generating optimal features to find out potent molecules against dengue virus: pharmacophore and QSAR approaches
From In Vitro to In Cellulo: Evaluation of Anti-TNFα Activity of a New Series of Small Molecules