The 4th International Electronic Conference on Atmospheric Sciences
ECAS 2021 has been a success! Welcome to the new electronic conference EACS 2023.
the chair
Dear Colleagues,
You are cordially invited to participate in the 4th International Electronic Conference on Atmospheric Sciences. In this meeting, we hope to build on the success of this conference series. We acknowledge that sharing our work face-to-face with our colleagues is preferred, but the continuing COVID-19 crisis has made this impossible. Technology is continuously improving the virtual experience and thus we will be taking advantage of the latest developments in order to create a quality online experience. Additionally, this will allow us to save for future conference budgets as well as increase our level of interaction. This online conference represents a new initiative that provides researchers of atmospheric science the opportunity to present their research and exchange ideas with their colleagues. Feedback from participants of the previous editions indicated that they were pleased with this format and would like to see the meeting grow.
For the 4th International Electronic Conference on Atmospheric Sciences, the range of topics will be more general; however, we are open to subject areas of thematic importance. During the last few decades, great strides have been made in all general areas of atmospheric science. We have seen the proliferation of remote sensing technologies and techniques for their use in research and forecasting. We have seen advances in the understanding of synoptic and dynamic meteorology, which have improved weather forecasting. Advances in the capabilities of atmospheric modeling as well as increases in computing power have enhanced our understanding of atmospheric behaviors on all time and space scales. Additionally, there have been discoveries related to the behavior of smaller-scale systems, especially those that interact with human activity, health, and economics. These have inspired techniques through which people can be warned when these events might affect them. The increased understanding of interannual and interdecadal variability in climate has also led to the development of long-range forecasting and projection. In conclusion, this conference will be organized around the following sessions and related themes, which correspond to the journal Atmosphere.
Conference Sessions
- Aerosols;
- Air Quality;
- Air Quality and Human Health;
- Climatology;
- Meteorology;
- Biometeorology;
- Atmospheric Techniques, Instrumentation, and Modelling;
- Biosphere/Hydrosphere/Land–Atmosphere Interactions;
- Upper Atmosphere;
- Planetary Atmospheres.
Conference Topics
- Atmospheric Physics: remote sensing; satellite and RADAR meteorology; water cycles; nowcasting; mesoscale models.
- Atmospheric Chemistry: air quality; atmospheric chemistry; upper atmospheric chemistry.
- Synoptic and Dynamic Meteorology: forecasting techniques; cyclone and anticyclone development; the jet stream and its behavior; blocking anticyclones; operational meteorology; forecast skills; forecast models.
- Regional Climate and Interannual Variability: El Nino; teleconnections; long-range prediction and projection; climate modeling; climate change; downscaling techniques.
- Tropical Meteorology: tropical storms; atmosphere–ocean interactions; modeling convection; the general circulation.
Accepted papers will be gathered in the journal Environmental Sciences Proceedings. Selected extended versions will be published in Atmosphere Special Issue "Advances in Atmospheric Sciences" after peer review with a discount of 20% on the article processing charge.
Prof. Dr. Anthony R. Lupo
Chair of ECAS 2021
Below is a Welcome Message from Prof. Dr. Anthony R. Lupo himself.
Meet the Event Chair

Important Dates

- Abstract submission deadlineMay 20, 2021
- Abstract acceptance notificationJun 01, 2021
- Full file submission deadlineJun 20, 2021
Meet Our Speakers

Prof. Dr. Andreas Matzarakis
Research Center Human Biometeorology, German Meteorological Service, Germany;

Dr. Francesca Costabile
Institute of Atmospheric Sciences and Climate (ISAC), National Research Council (CNR), Italy;

Dr. Haider A. Khwaja
Environmental Atmospheric Chemistry Laboratory, School of Public Health, University at Albany, State University of New York, USA;

Prof. Dr. Ilias Kavouras
Environmental, Occupational, and Geospatial Health Sciences, CUNY School of Public Health, USA;

Prof. Dr. Riccardo Buccolieri
Dipartimento di Scienze e Tecnologie Biologiche ed Ambientali (DiSTeBA), University of Salento, Italy;
Dr. Darius Ceburnis
School of Physics and Centre for Climate & Air Pollution Studies, Ryan Institute, National University of Ireland Galway, University Road, Ireland;
- S1. Aerosols
- S2. Air Quality
- S3. Air Quality and Human Health
- S4. Climatology
- S5. Meteorology
Sponsors and Partners
Organizer

Media partner
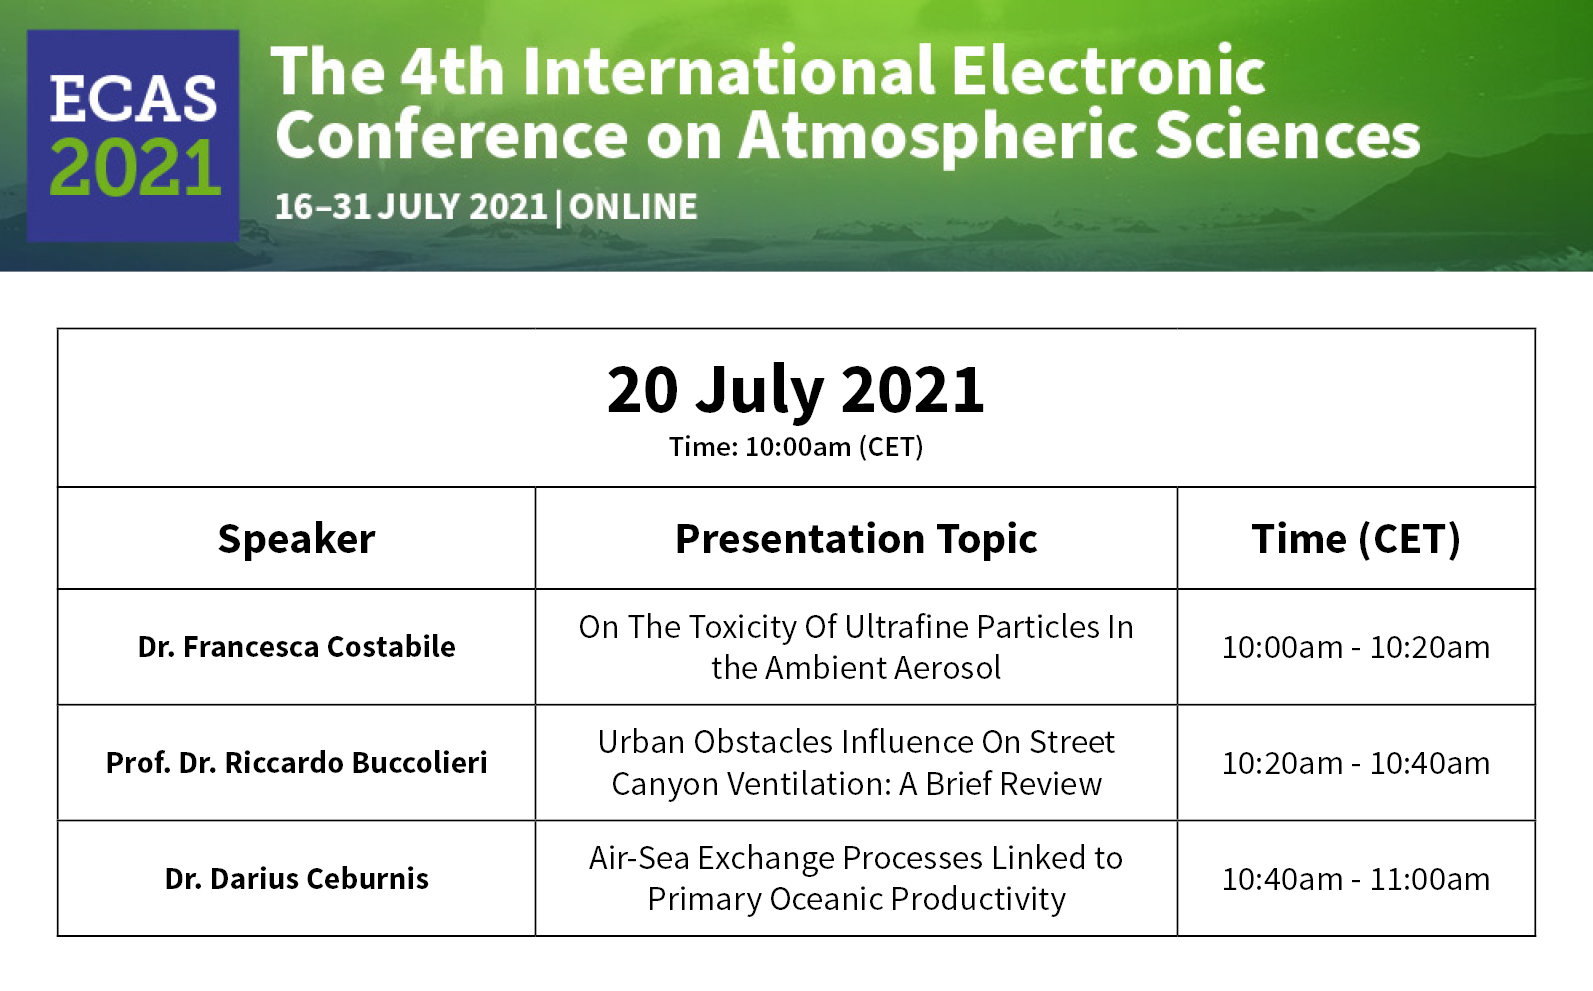


Live Session 1 - 20.07.2021
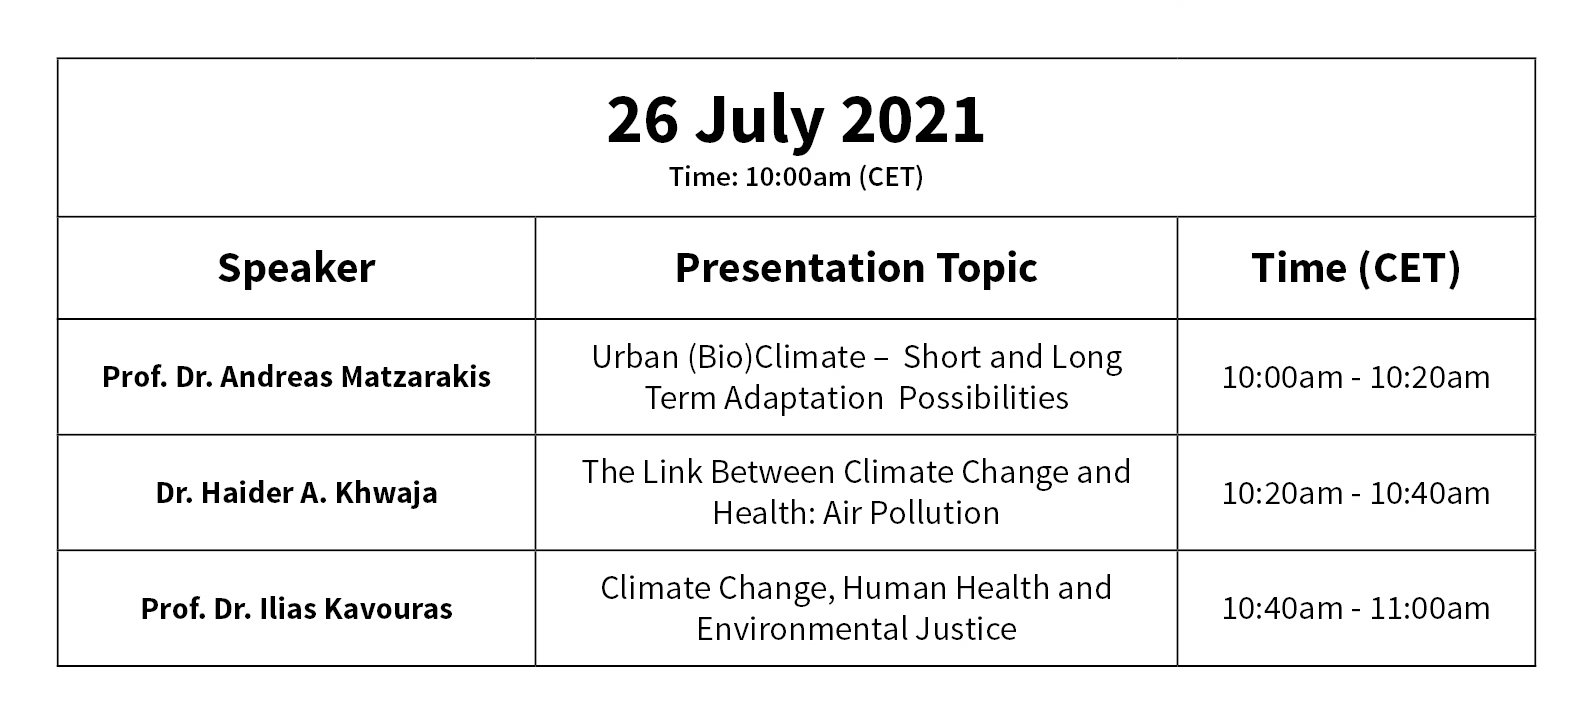
Live Session 2 - 26.07.2021
Ms. Alicia Wang、Ms. Olivia Liu、Ms. Chloe Li
MDPI Branch Office, Wuhan
E-Mail: ecas2021@mdpi.com