Event submissions
EventsThe 5th International Electronic Conference on Brain Sciences & 1st International Electronic Conference on Neurosciences
Published
This submission belongs to the session S7. Systems Neuroscience of the event The 5th International Electronic Conference on Brain Sciences & 1st International Electronic Conference on Neurosciences
Published date
04 Mar, 2026
Academic Editor
'%3e%3cpath%20d='M12.6657%2010.9104C12.4185%2010.325%2012.0599%209.79327%2011.6097%209.34482C11.1609%208.89508%2010.6293%208.5365%2010.0442%208.28888C10.0389%208.28626%2010.0337%208.28495%2010.0285%208.28233C10.8446%207.69279%2011.3752%206.73249%2011.3752%205.64904C11.3752%203.8542%209.92103%202.39999%208.1262%202.39999C6.33136%202.39999%204.87715%203.8542%204.87715%205.64904C4.87715%206.73249%205.40774%207.69279%206.22393%208.28364C6.21869%208.28626%206.21345%208.28757%206.20821%208.29019C5.62129%208.5378%205.09463%208.89284%204.64265%209.34613C4.1929%209.79493%203.83432%2010.3266%203.58671%2010.9117C3.34345%2011.4845%203.21226%2012.0987%203.20023%2012.7209C3.19988%2012.7349%203.20233%2012.7488%203.20744%2012.7619C3.21255%2012.7749%203.22022%2012.7867%203.22998%2012.7968C3.23975%2012.8068%203.25142%2012.8147%203.26431%2012.8202C3.2772%2012.8256%203.29105%2012.8284%203.30504%2012.8284H4.09109C4.14874%2012.8284%204.19459%2012.7825%204.1959%2012.7262C4.2221%2011.7148%204.62823%2010.7676%205.34617%2010.0497C6.08899%209.30683%207.0755%208.89808%208.1262%208.89808C9.17689%208.89808%2010.1634%209.30683%2010.9062%2010.0497C11.6242%2010.7676%2012.0303%2011.7148%2012.0565%2012.7262C12.0578%2012.7838%2012.1037%2012.8284%2012.1613%2012.8284H12.9474C12.9613%2012.8284%2012.9752%2012.8256%2012.9881%2012.8202C13.001%2012.8147%2013.0126%2012.8068%2013.0224%2012.7968C13.0322%2012.7867%2013.0398%2012.7749%2013.0449%2012.7619C13.0501%2012.7488%2013.0525%2012.7349%2013.0522%2012.7209C13.0391%2012.0947%2012.9094%2011.4855%2012.6657%2010.9104ZM8.1262%207.9024C7.52486%207.9024%206.9589%207.6679%206.53312%207.24211C6.10733%206.81633%205.87283%206.25037%205.87283%205.64904C5.87283%205.0477%206.10733%204.48174%206.53312%204.05596C6.9589%203.63018%207.52486%203.39567%208.1262%203.39567C8.72753%203.39567%209.29349%203.63018%209.71927%204.05596C10.1451%204.48174%2010.3796%205.0477%2010.3796%205.64904C10.3796%206.25037%2010.1451%206.81633%209.71927%207.24211C9.29349%207.6679%208.72753%207.9024%208.1262%207.9024Z'%20fill='%235D1EE1'/%3e%3c/g%3e%3c/svg%3e) Vasileios T. Papaliagkas
Vasileios T. PapaliagkasCitation
Souhaila Khalfallah, Kais Bouallegue, Interactive Brain Interface for Multimodal EEG Visualization and Disease-Specific Neural Dynamics, in Proceedings of The 5th International Electronic Conference on Brain Sciences & 1st International Electronic Conference on Neurosciences, 9 March–11 March 2026, MDPI: Basel, Switzerland
Share
Email
Facebook
Twitter
LinkedIn
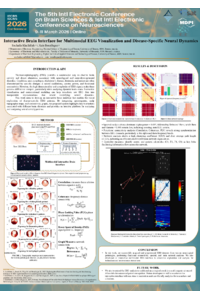
Interactive Brain Interface for Multimodal EEG Visualization and Disease-Specific Neural Dynamics
'%3e%3cpath%20d='M12.6647%2010.9104C12.4176%2010.325%2012.0589%209.7933%2011.6088%209.34485C11.16%208.89511%2010.6283%208.53653%2010.0432%208.28891C10.038%208.28629%2010.0327%208.28498%2010.0275%208.28236C10.8437%207.69282%2011.3743%206.73252%2011.3743%205.64907C11.3743%203.85423%209.92005%202.40002%208.12522%202.40002C6.33038%202.40002%204.87618%203.85423%204.87618%205.64907C4.87618%206.73252%205.40677%207.69282%206.22296%208.28367C6.21772%208.28629%206.21248%208.2876%206.20724%208.29022C5.62031%208.53783%205.09365%208.89287%204.64167%209.34616C4.19192%209.79496%203.83334%2010.3266%203.58573%2010.9117C3.34247%2011.4846%203.21128%2012.0987%203.19925%2012.721C3.1989%2012.735%203.20135%2012.7489%203.20646%2012.7619C3.21157%2012.7749%203.21924%2012.7868%203.22901%2012.7968C3.23877%2012.8068%203.25045%2012.8148%203.26334%2012.8202C3.27623%2012.8256%203.29007%2012.8284%203.30406%2012.8284H4.09012C4.14776%2012.8284%204.19362%2012.7825%204.19493%2012.7262C4.22113%2011.7148%204.62726%2010.7676%205.34519%2010.0497C6.08802%209.30686%207.07452%208.89811%208.12522%208.89811C9.17592%208.89811%2010.1624%209.30686%2010.9052%2010.0497C11.6232%2010.7676%2012.0293%2011.7148%2012.0555%2012.7262C12.0568%2012.7839%2012.1027%2012.8284%2012.1603%2012.8284H12.9464C12.9604%2012.8284%2012.9742%2012.8256%2012.9871%2012.8202C13%2012.8148%2013.0117%2012.8068%2013.0214%2012.7968C13.0312%2012.7868%2013.0389%2012.7749%2013.044%2012.7619C13.0491%2012.7489%2013.0515%2012.735%2013.0512%2012.721C13.0381%2012.0947%2012.9084%2011.4856%2012.6647%2010.9104ZM8.12522%207.90243C7.52388%207.90243%206.95792%207.66793%206.53214%207.24215C6.10636%206.81636%205.87185%206.2504%205.87185%205.64907C5.87185%205.04773%206.10636%204.48177%206.53214%204.05599C6.95792%203.63021%207.52388%203.3957%208.12522%203.3957C8.72655%203.3957%209.29252%203.63021%209.7183%204.05599C10.1441%204.48177%2010.3786%205.04773%2010.3786%205.64907C10.3786%206.2504%2010.1441%206.81636%209.7183%207.24215C9.29252%207.66793%208.72655%207.90243%208.12522%207.90243Z'%20fill='%235D1EE1'/%3e%3c/g%3e%3c/svg%3e)
Souhaila Khalfallah 1
Kais Bouallegue 2
1. Laboratory of Electronic and Microelectronic, Faculty of Sciences of Monastir, University of Monastir, Monastir 5019, Tunisia, Tunisia
2. Higher Institute of Applied Sciences and Technologies of Sousse, Electronics and Microelectronics Laboratory - fsm - University of Monastir, Monastir, Tunisia, Tunisia
Abstract
Understanding how brain activity changes across neurological and neurodevelopmental disorders requires tools that can reveal patterns hidden in complex EEG data. Conditions such as epilepsy, Alzheimer’s disease, dementia, and autism often produce distinct alterations in neural oscillations and connectivity, but these signatures can be difficult to interpret in real time. In this work, we present an interactive brain interface designed to visually explore disease-specific EEG dynamics through integrated spectrograms, topographic maps, and connectivity graphs.
Our system combines classical signal-processing techniques with computational modeling to generate a multi-layer representation of ongoing brain activity. EEG segments are analyzed to extract spectral features, inter-electrode coherence, and spatial activation patterns. The interface simulates key biomarkers for each condition, including epileptic spike–wave discharges, Alzheimer-related reductions in alpha power, dementia-associated slowing, and atypical connectivity profiles observed in autism. A dedicated seizure module models the rapid synchronization that occurs during ictal events, highlighting propagation pathways across the scalp. All visual components, EEG waveforms, frequency-band power, scalp topomaps, and graph-based networks, update continuously, allowing users to observe how brain states evolve over time.
Initial results demonstrate that the interface effectively captures meaningful differences between disorders, making high-dimensional EEG patterns easier to understand and compare. Epileptic simulations display strong bursts and dense network coupling, while neurodegenerative modes show weakened connectivity and spectral slowing. These visualizations offer an intuitive yet rigorous way to explore neural dynamics.
Overall, the project illustrates how computational neuroscience, mathematical modeling, and interactive visualization can be combined to create an accessible tool for research, education, and potential clinical support. This interface provides a flexible platform for studying how neural circuits behave across diverse brain conditions and how their dynamics relate to cognition and behavior.
Keywords
EEG visualization
Computational neuroscience
Brain–computer interface (BCI)
Poster
sciforum-159252 poster_iecn2026.pdf
Task-dependent modulation of aftereffects during visuomotor adaptation
Recurrence Network Analysis Uncovering Biomarkers of Depression from Nonlinear Dynamics underlying EEG Signals